1967 Japanese general election
| |||||||||||||||||||||||||||||||||||||||||||||||||||||||||||||||||
All 486 seats in the House of Representatives 244 seats needed for a majority | |||||||||||||||||||||||||||||||||||||||||||||||||||||||||||||||||
|---|---|---|---|---|---|---|---|---|---|---|---|---|---|---|---|---|---|---|---|---|---|---|---|---|---|---|---|---|---|---|---|---|---|---|---|---|---|---|---|---|---|---|---|---|---|---|---|---|---|---|---|---|---|---|---|---|---|---|---|---|---|---|---|---|---|
| Turnout | 73.98% ( | ||||||||||||||||||||||||||||||||||||||||||||||||||||||||||||||||
| |||||||||||||||||||||||||||||||||||||||||||||||||||||||||||||||||
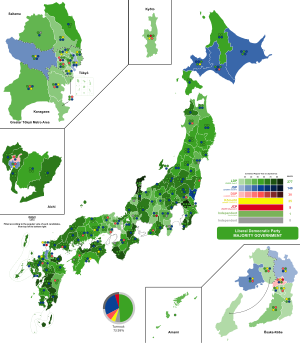
 Districts shaded according to winners' vote strength | |||||||||||||||||||||||||||||||||||||||||||||||||||||||||||||||||
| |||||||||||||||||||||||||||||||||||||||||||||||||||||||||||||||||
| This article is part of a series on |
 |
|---|
|
|
General elections were held in Japan on 29 January 1967. The result was a victory for the Liberal Democratic Party, which won 277 of the 486 seats.[1] Voter turnout was 73.99%.
Prime Minister Eisaku Satō had dissolved parliament in 1966, following a number of what was called Black Fog Incidents, such as the resignation of Transport Minister Seijuro Arafune and calls for greater reform in 1966. The results did not radically alter the landscape of Japanese politics, although both the government and opposition were disappointed; the Liberal Democratic Party's vote share fell below 50% for the first time ever, and the Japan Socialist Party also lost seats, with Kōzō Sasaki, who had served as Chairman, resigning a few months after the election. However, more minor opposition parties made gains. This was the first election in which Komeito ran, and won nearly 25 seats, with the DSP also seeing a gain of six seats to hit thirty. The Japanese Communist Party also saw a slight increase in vote count, though did not gain any seats.
Results
 | |||||
|---|---|---|---|---|---|
| Party | Votes | % | Seats | +/– | |
| Liberal Democratic Party | 22,447,838 | 48.80 | 277 | –6 | |
| Japan Socialist Party | 12,826,104 | 27.88 | 140 | –4 | |
| Democratic Socialist Party | 3,404,464 | 7.40 | 30 | +7 | |
| Komeitō | 2,472,371 | 5.38 | 25 | New | |
| Japanese Communist Party | 2,190,564 | 4.76 | 5 | 0 | |
| Other parties | 101,244 | 0.22 | 0 | – | |
| Independents | 2,553,989 | 5.55 | 9 | –3 | |
| Total | 45,996,574 | 100.00 | 486 | +19 | |
| Valid votes | 45,996,574 | 98.71 | |||
| Invalid/blank votes | 602,882 | 1.29 | |||
| Total votes | 46,599,456 | 100.00 | |||
| Registered voters/turnout | 62,992,796 | 73.98 | |||
| Source: Nohlen et al. | |||||
By prefecture
| Prefecture | Total seats |
Seats won | |||||
|---|---|---|---|---|---|---|---|
| LDP | JSP | DSP | Komeitō | JCP | Ind. | ||
| Aichi | 20 | 12 | 5 | 2 | 1 | ||
| Akita | 8 | 5 | 2 | 1 | |||
| Aomori | 7 | 4 | 3 | ||||
| Chiba | 13 | 10 | 3 | ||||
| Ehime | 9 | 7 | 1 | 1 | |||
| Fukui | 4 | 3 | 1 | ||||
| Fukuoka | 19 | 8 | 6 | 2 | 2 | 1 | |
| Fukushima | 12 | 8 | 3 | 1 | |||
| Gifu | 9 | 6 | 2 | 1 | |||
| Gunma | 10 | 7 | 3 | ||||
| Hiroshima | 12 | 8 | 3 | 1 | |||
| Hokkaido | 22 | 10 | 10 | 1 | 1 | ||
| Hyōgo | 19 | 8 | 5 | 4 | 2 | ||
| Ibaraki | 12 | 8 | 3 | 1 | |||
| Ishikawa | 6 | 5 | 1 | ||||
| Iwate | 8 | 5 | 3 | ||||
| Kagawa | 6 | 4 | 2 | ||||
| Kagoshima | 11 | 8 | 3 | ||||
| Kanagawa | 14 | 4 | 5 | 3 | 2 | ||
| Kōchi | 5 | 2 | 2 | 1 | |||
| Kumamoto | 10 | 8 | 2 | ||||
| Kyoto | 10 | 4 | 2 | 2 | 1 | 1 | |
| Mie | 9 | 7 | 2 | ||||
| Miyagi | 9 | 5 | 3 | 1 | |||
| Miyazaki | 6 | 4 | 1 | 1 | |||
| Nagano | 13 | 8 | 4 | 1 | |||
| Nagasaki | 9 | 6 | 3 | ||||
| Nara | 5 | 2 | 2 | 1 | |||
| Niigata | 15 | 9 | 6 | ||||
| Ōita | 7 | 5 | 2 | ||||
| Okayama | 10 | 5 | 4 | 1 | |||
| Osaka | 23 | 8 | 4 | 4 | 6 | 1 | |
| Saga | 5 | 3 | 2 | ||||
| Saitama | 13 | 6 | 5 | 1 | 1 | ||
| Shiga | 5 | 3 | 2 | ||||
| Shimane | 5 | 4 | 1 | ||||
| Shizuoka | 14 | 8 | 4 | 1 | 1 | ||
| Tochigi | 10 | 6 | 3 | 1 | |||
| Tokushima | 5 | 3 | 1 | 1 | |||
| Tokyo | 39 | 16 | 13 | 3 | 6 | 1 | |
| Tottori | 4 | 3 | 1 | ||||
| Toyama | 6 | 4 | 2 | ||||
| Wakayama | 6 | 5 | 1 | ||||
| Yamagata | 8 | 5 | 3 | ||||
| Yamaguchi | 9 | 6 | 2 | 1 | |||
| Yamanashi | 5 | 2 | 2 | 1 | |||
| Total | 486 | 277 | 140 | 30 | 25 | 5 | 9 |
References
- ^ "統計局ホームページ/第27章 公務員・選挙". Archived from the original on 2015-02-15. Retrieved 2012-12-19.


