N2 chart

The N2 chart or N2 diagram (pronounced "en-two" or "en-squared") is a chart or diagram in the shape of a matrix, representing functional or physical interfaces between system elements. It is used to systematically identify, define, tabulate, design, and analyze functional and physical interfaces. It applies to system interfaces and hardware and/or software interfaces.[2]
The N-squared chart was invented by the systems engineer Robert J. Lano, while working at TRW in the 1970s and first published in a 1977 TRW internal report.[3]
Overview
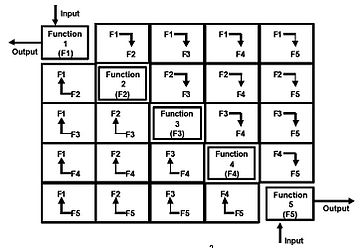
The N2 diagram has been used extensively to develop data interfaces, primarily in the software areas. However, it can also be used to develop hardware interfaces. The basic N2 chart is shown in Figure 2. The system functions are placed on the diagonal; the remainder of the squares in the N × N matrix represent the interface inputs and outputs. [4]
 |
 |
Where a blank appears, there is no interface between the respective functions. Data flows in a clockwise direction between functions (e.g., the symbol F1 F2 indicates data flowing from function F1, to function F2). The data being transmitted can be defined in the appropriate squares. Alternatively, the use of circles and numbers permits a separate listing of the data interfaces. The clockwise flow of data between functions that have a feedback loop can be illustrated by a larger circle called a control loop. The identification of a critical function is also shown in Figure 3, where function F4 has a number of inputs and outputs to all other functions in the upper module. A simple flow of interface data exists between the upper and lower modules at functions F7 and F8. The lower module has complex interaction among its functions. The N2 chart can be taken down into successively lower levels to the hardware and software component functional levels. In addition to defining the data that must be supplied across the interface, the N2 chart can pinpoint areas where conflicts could arise.[4]
N2 charts building blocks
Number of entities
The "N" in an N2 diagram is the number of entities for which relationships are shown. This N × N matrix requires the user to generate complete definitions of all interfaces in a rigid bidirectional, fixed framework. The user places the functional or physical entities on the diagonal axis and the interface inputs and outputs in the remainder of the diagram squares. A blank square indicates that there is no interface between the respective entities. Data flows clockwise between entities (i.e., the symbol F1 → F2, in Figure 4, indicates data flowing from function F1 to function F2; the symbol F2 → F1 indicates the feedback). That which passes across the interface is defined in the appropriate squares.
The diagram is complete when the user has compared each entity to all other entities. The N2 diagram should be used in each successively lower level of entity decomposition. Figure 1 illustrates directional flow of interfaces between entities within an N2 diagram. (In this case, the entities are functions.)
Functions on the diagonal

In the example on the right, N equals 5. The five functions are on the diagonal. The arrows show the flow of data between functions. So if function 1 sends data to function 2, the data elements would be placed in the box to the right of function 1. If function 1 does not send data to any of the other functions, the rest of the boxes to right of function 1 would be empty. If function 2 sends data to function 3 and function 5, then the data elements would be placed in the first and third boxes to the right of function 2. If any function sends data back to a previous function, then the associated box to the left of the function would have the data elements placed in it. The squares on either side of the diagonal (not just adjacent squares) are filled in with appropriate data to depict the flow between the functions. If there is no interface between two functions, the square that represents the interface between the two functions is left blank. Physical interfaces would be handled in the same manner, with the physical entities on the diagonal rather than the functional entities.
Contextual and administrative data
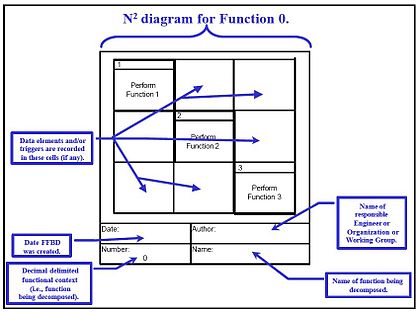
Each N2 diagram shall contain at a minimum the following contextual and administrative data:
- Date the diagram was created
- Name of the engineer, organization, or working group that created the diagram
- Unique decimal delimited number of the functional or physical entity being diagrammed
- Unique name for the functional or physical entity being diagrammed
N2 diagrams are a valuable tool for not only identifying functional or physical interfaces, but also for pinpointing areas in which conflicts may arise with interfaces so that system integration proceeds smoothly and efficiently.

Figure 5 presents information in an N2 diagram, which complements the Functional flow block diagram. Notice that in this illustration, there are no data elements or triggers. The figure illustrates the context between functions at different levels of the model.
Examples
Figure 6 is an example of the diagram's appearance when cells are populated with data.[5]

See also
- Business process mapping
- DRAKON
- Flow chart
- Function model
- Function block diagram
- Functional flow block diagram
References
- ^ John Azzolini (2000). Introduction to Systems Engineering Practices. July 2000.
- ^ The first version of this article is completely based on the NAS SYSTEM ENGINEERING MANUAL SECTION Archived 2009-01-14 at the Wayback Machine 4.4 VERSION 3.1 06/06/06.
- ^ Lano, R. (1977). The N2 Chart. TRW Software Series, Redondo Beach, CA.
- ^ a b c d NASA (1995). "Techniques of Functional Analysis". In: NASA Systems Engineering Handbook Archived 2008-12-17 at the Wayback Machine June 1995. p.142.
- ^ Federal Aviation Administration (2006). System Engineering Functional N2 Diagram