Northern Hungary
Northern Hungary
Észak-Magyaroszág | |
|---|---|
 | |
| Country | |
| Capital city | Miskolc |
| Area | |
| • Total | 13,428 km2 (5,185 sq mi) |
| Population | |
| • Total | 1,209,142 |
| • Density | 90/km2 (200/sq mi) |
| Time zone | UTC+1 (CET) |
| • Summer (DST) | UTC+2 (CEST) |
| NUTS code | HU31 |
| GDP per capita (PPS) | €13,700 (2017)[1] |
| HDI (2019) | 0.819[2] very high · 7th |
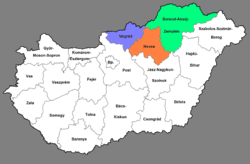
Northern Hungary (Hungarian: Észak-Magyarország) is a region in Hungary. As a statistical region it includes the counties Borsod-Abaúj-Zemplén, Heves and Nógrád, but in colloquial speech it usually also refers to Szabolcs-Szatmár-Bereg county. The region is in the north-eastern part of the country. The region's centre and largest city is Miskolc.
Tourist sights

Castles
- Castle of Eger
- Castle of Diósgyőr
- Castle of Füzér
- Castle of Sárospatak
Cities and major towns
Miskolc, Eger, Salgótarján, Ózd, Kazincbarcika, Mezőkövesd, Sárospatak, Sátoraljaújhely, Tiszaújváros, Tokaj, Gyöngyös, Szerencs, Hatvan, Balassagyarmat.
Some data
- GDP (PPS) per capita
2000 : 6 774 € ![]()
2001 : 7 519 € ![]() 845 €
845 €
2002 : 8 028 € ![]() 509 €
509 €
2003 : 8 426 € ![]() 398 €
398 €
2004 : 9 064 € ![]() 638 €
638 €
2005 : 9 321 € ![]() 257 €
257 €
2006 : 9 572 € ![]() 251 €
251 €
2007 : 9 981 € ![]() 409 €
409 €
2001 : 1,47 births/woman ![]()
2002 : 1,45 births/woman ![]()
2003 : 1,41 births/woman ![]()
2004 : 1,42 births/woman ![]()
2005 : 1,44 births/woman ![]()
2006 : 1,49 births/woman ![]()
2007 : 1,45 births/woman ![]()
2008 : 1,49 births/woman ![]()
2009 : 1,47 births/woman ![]()
2000 : 10,1 % ![]()
2001 : 8,5% ![]()
2002 : 8,8% ![]()
2003 : 9,7% ![]()
2004 : 9,7% ![]()
2005 : 10,6% ![]()
2006 : 11,0% ![]()
2007 : 12,3% ![]()
2008 : 13,4% ![]()
2009 : 15,3% ![]()
Men :
2000: 66,20 year ![]()
2001: 66,73 year ![]()
2002: 66,68 year ![]()
2003: 66,68 year ![]()
2004: 66,97 year ![]()
2005: 66,84 year ![]()
2006: 67,37 year ![]()
2007: 67,54 year ![]()
2008: 67,90 year ![]()
2009: 68,37 year ![]()
Women :
2000 : 75,25 year ![]()
2001 : 76,26 year ![]()
2002 : 76,00 year ![]()
2003 : 75,84 year ![]()
2004 : 75,80 year ![]()
2005 : 75,93 year ![]()
2006 : 76,39 year ![]()
2007 : 76,43 year ![]()
2008 : 77,05 year ![]()
2009 : 76,70 year ![]()
See also
References
- ^ Eurostat (26 February 2019). "GDP per capita in 281 EU regions in 2017". Europa web portal. Retrieved 27 February 2019.
- ^ "Sub-national HDI - Area Database - Global Data Lab". hdi.globaldatalab.org. Retrieved 2021-07-21.
External links
 Northern Hungary travel guide from Wikivoyage
- Official site of the Region of Northern Hungary