United States Senate elections, 1982
| ||||||||||||||||||||||||||||||||||||||||||||||||||||||||||||||||||||
33 of the 100 seats in the United States Senate 51 seats needed for a majority | ||||||||||||||||||||||||||||||||||||||||||||||||||||||||||||||||||||
|---|---|---|---|---|---|---|---|---|---|---|---|---|---|---|---|---|---|---|---|---|---|---|---|---|---|---|---|---|---|---|---|---|---|---|---|---|---|---|---|---|---|---|---|---|---|---|---|---|---|---|---|---|---|---|---|---|---|---|---|---|---|---|---|---|---|---|---|---|
| ||||||||||||||||||||||||||||||||||||||||||||||||||||||||||||||||||||
 Results of the elections: Democratic gain Republican gain Democratic hold Republican hold No election | ||||||||||||||||||||||||||||||||||||||||||||||||||||||||||||||||||||
| ||||||||||||||||||||||||||||||||||||||||||||||||||||||||||||||||||||
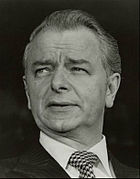
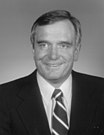
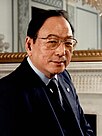
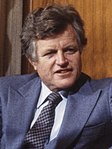
The 1982 United States Senate elections were held on November 2, 1982. They were elections for the United States Senate following Republican gains in 1980. The 33 Senate seats of Class 1 were up for election in 1982. A total of four seats changed hands between parties, with Democrats winning seats in New Jersey and New Mexico, and Republicans taking seats in Nevada and the seat of the lone independent, Senator Harry Byrd Jr., in Virginia. Democrats made a net gain of one seat bringing them to 46 seats, while Republicans stayed at 54 seats for a majority. However, the Democratic gain in New Jersey replaced a Republican that had been appointed earlier in the year. Liberal Republicans senators in Connecticut, Rhode Island and Vermont held onto their seats, keeping the Senate in Republican hands.
A special election was also held in Washington state in 1983 that gave Republicans a seat that was previously held by a Democrat, bringing their majority to 55–45. As of 2024[update], this is the last time Democrats won a U.S. Senate election in Mississippi and the last time Republicans won one in Connecticut.[citation needed]
Results summary
| 46 | 54 |
| Democratic | Republican |
| Parties | Total | ||||||||||||||||||||||||||||||||||||||||||||||||||||||||||||||||||||||||||||||||||||||||||||||||||
|---|---|---|---|---|---|---|---|---|---|---|---|---|---|---|---|---|---|---|---|---|---|---|---|---|---|---|---|---|---|---|---|---|---|---|---|---|---|---|---|---|---|---|---|---|---|---|---|---|---|---|---|---|---|---|---|---|---|---|---|---|---|---|---|---|---|---|---|---|---|---|---|---|---|---|---|---|---|---|---|---|---|---|---|---|---|---|---|---|---|---|---|---|---|---|---|---|---|---|---|
| Democratic | Republican | Independent | Libertarian | Other | |||||||||||||||||||||||||||||||||||||||||||||||||||||||||||||||||||||||||||||||||||||||||||||||
| Last elections (1980) | 46 | 53 | 1 | 0 | 0 | 100 | |||||||||||||||||||||||||||||||||||||||||||||||||||||||||||||||||||||||||||||||||||||||||||||
| Before these elections | 45 | 54 | 1 | 0 | 0 | 100 | |||||||||||||||||||||||||||||||||||||||||||||||||||||||||||||||||||||||||||||||||||||||||||||
| Not up | 26 | 41 | 0 | 0 | 0 | 67 | |||||||||||||||||||||||||||||||||||||||||||||||||||||||||||||||||||||||||||||||||||||||||||||
| Up Class 1 (1976→1982) |
19 | 13 | 1 | — | — | 33 | |||||||||||||||||||||||||||||||||||||||||||||||||||||||||||||||||||||||||||||||||||||||||||||
| Incumbent retired | 0 | 2 | 1 | — | — | 3 | |||||||||||||||||||||||||||||||||||||||||||||||||||||||||||||||||||||||||||||||||||||||||||||
| Held by same party | — | 1 | 0 | — | — | 1 | |||||||||||||||||||||||||||||||||||||||||||||||||||||||||||||||||||||||||||||||||||||||||||||
| Replaced by other party | — | — | 2 | ||||||||||||||||||||||||||||||||||||||||||||||||||||||||||||||||||||||||||||||||||||||||||||||||
| Result | 1 | 2 | 0 | — | — | 3 | |||||||||||||||||||||||||||||||||||||||||||||||||||||||||||||||||||||||||||||||||||||||||||||
| Incumbent ran | 19[a] | 11 | 0 | — | — | 30 | |||||||||||||||||||||||||||||||||||||||||||||||||||||||||||||||||||||||||||||||||||||||||||||
| Won re-election | 18 | 10 | — | — | — | 28 | |||||||||||||||||||||||||||||||||||||||||||||||||||||||||||||||||||||||||||||||||||||||||||||
| Lost re-election | — | — | — | 2 | |||||||||||||||||||||||||||||||||||||||||||||||||||||||||||||||||||||||||||||||||||||||||||||||
| Lost renomination, but held by same party |
0 | 0 | — | — | — | 0 | |||||||||||||||||||||||||||||||||||||||||||||||||||||||||||||||||||||||||||||||||||||||||||||
| Result | 19 | 11 | 0 | — | — | 30 | |||||||||||||||||||||||||||||||||||||||||||||||||||||||||||||||||||||||||||||||||||||||||||||
| Total elected | 20 | 13 | 0 | 0 | 0 | 33 | |||||||||||||||||||||||||||||||||||||||||||||||||||||||||||||||||||||||||||||||||||||||||||||
| Net gain/loss | 1 | ||||||||||||||||||||||||||||||||||||||||||||||||||||||||||||||||||||||||||||||||||||||||||||||||||
| Nationwide vote | 27,899,651 | 22,412,928 | 146,512 | 291,576 | 839,328 | 51,589,995 | |||||||||||||||||||||||||||||||||||||||||||||||||||||||||||||||||||||||||||||||||||||||||||||
| Share | 54.08% | 43.44% | 0.28% | 0.57% | 1.63% | 100% | |||||||||||||||||||||||||||||||||||||||||||||||||||||||||||||||||||||||||||||||||||||||||||||
| Result | 46 | 54 | 0 | 0 | 0 | 100 | |||||||||||||||||||||||||||||||||||||||||||||||||||||||||||||||||||||||||||||||||||||||||||||
Source: Office of the Clerk[1]
Gains, losses, and holds
Retirements
Two Republicans and one independent retired instead of seeking re-election.
| State | Senator | Replaced by |
|---|---|---|
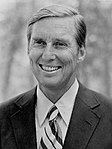
| California | S. I. Hayakawa | Pete Wilson |
| New Jersey | Nicholas F. Brady | Frank Lautenberg |
| Virginia | Harry F. Byrd Jr. | Paul Trible |
Defeats
One Republican and one Democrat sought re-election but lost in the general election.
| State | Senator | Replaced by |
|---|---|---|
| Nevada | Howard Cannon | Chic Hecht |
| New Mexico | Harrison Schmitt | Jeff Bingaman |
Post-election changes
One Democrat died on September 8, 1983, and was later replaced by Republican appointee.
| State | Senator | Replaced by |
|---|---|---|
| Washington (Class 1) |
Henry M. Jackson | Daniel J. Evans |
Change in composition
Before the elections
| D1 | D2 | D3 | D4 | D5 | D6 | D7 | D8 | D9 | D10 |
| D20 | D19 | D18 | D17 | D16 | D15 | D14 | D13 | D12 | D11 |
| D21 | D22 | D23 | D24 | D25 | D26 | D27 Ariz. Ran |
D28 Fla. Ran |
D29 Hawaii Ran |
D30 Maine Ran |
| D40 Ohio Ran |
D39 N.D. Ran |
D38 N.Y. Ran |
D37 Nev. Ran |
D36 Neb. Ran |
D35 Mont. Ran |
D34 Miss. Ran |
D33 Mich. Ran |
D32 Mass. Ran |
D31 Md. Ran |
| D41 Tenn. Ran |
D42 Texas Ran |
D43 Wash. Ran |
D44 W.Va. Ran |
D45 Wis. Ran |
I1 Va. Retired |
R54 Wyo. Ran |
R53 Vt. Ran |
R52 Utah Ran |
R51 R.I. Ran |
| Majority → | |||||||||
| R41 | R42 Calif. Retired |
R43 Conn. Ran |
R44 Del. Ran |
R45 Ind. Ran |
R46 Minn. Ran |
R47 Mo. Ran |
R48 N.J. Retired |
R49 N.M. Ran |
R50 Pa. Ran |
| R40 | R39 | R38 | R37 | R36 | R35 | R34 | R33 | R32 | R31 |
| R21 | R22 | R23 | R24 | R25 | R26 | R27 | R28 | R29 | R30 |
| R20 | R19 | R18 | R17 | R16 | R15 | R14 | R13 | R12 | R11 |
| R1 | R2 | R3 | R4 | R5 | R6 | R7 | R8 | R9 | R10 |
After the elections
| D1 | D2 | D3 | D4 | D5 | D6 | D7 | D8 | D9 | D10 |
| D20 | D19 | D18 | D17 | D16 | D15 | D14 | D13 | D12 | D11 |
| D21 | D22 | D23 | D24 | D25 | D26 | D27 Ariz. Re-elected |
D28 Fla. Re-elected |
D29 Hawaii Re-elected |
D30 Maine Elected[b] |
| D40 Tenn. Re-elected |
D39 Ohio Re-elected |
D38 N.D. Re-elected |
D37 N.Y. Re-elected |
D36 Neb. Re-elected |
D35 Mont. Re-elected |
D34 Miss. Re-elected |
D33 Mich. Re-elected |
D32 Mass. Re-elected |
D31 Md. Re-elected |
| D41 Texas Re-elected |
D42 Wash. Re-elected |
D43 W.Va. Re-elected |
D44 Wis. Re-elected |
D45 N.J. Gain |
D46 N.M. Gain |
R54 Va. Gain |
R53 Nev. Gain |
R52 Wyo. Re-elected |
R51 Vt. Re-elected |
| Majority → | |||||||||
| R41 | R42 Calif. Hold |
R43 Conn. Re-elected |
R44 Del. Re-elected |
R45 Ind. Re-elected |
R46 Minn. Re-elected |
R47 Mo. Re-elected |
R48 Pa. Re-elected |
R49 R.I. Re-elected |
R50 Utah Re-elected |
| R40 | R39 | R38 | R37 | R36 | R35 | R34 | R33 | R32 | R31 |
| R21 | R22 | R23 | R24 | R25 | R26 | R27 | R28 | R29 | R30 |
| R20 | R19 | R18 | R17 | R16 | R15 | R14 | R13 | R12 | R11 |
| R1 | R2 | R3 | R4 | R5 | R6 | R7 | R8 | R9 | R10 |
| Key |
|
|---|
Race summaries
Special elections
There were no special elections during 1982.
Elections leading to the next Congress
In these general elections, the winners were elected for the term beginning January 3, 1983; ordered by state.
All of the elections involved the Class 1 seats.
| State | Incumbent | Result | Candidates | ||
|---|---|---|---|---|---|
| Senator | Party | Electoral history | |||
| Arizona | Dennis DeConcini | Democratic | 1976 | Incumbent re-elected. |
|
| California | S. I. Hayakawa | Republican | 1976 1977 (appointed) |
Incumbent retired. Republican hold. |
Others
|
| Connecticut | Lowell Weicker | Republican | 1970 1976 |
Incumbent re-elected. |
|
| Delaware | William Roth | Republican | 1970 1971 (appointed) 1976 |
Incumbent re-elected. |
|
| Florida | Lawton Chiles | Democratic | 1970 1976 |
Incumbent re-elected. |
|
| Hawaii | Spark Matsunaga | Democratic | 1976 | Incumbent re-elected. |
|
| Indiana | Richard Lugar | Republican | 1976 | Incumbent re-elected. |
|
| Maine | George J. Mitchell | Democratic | 1980 (appointed) | Interim appointee elected. |
|
| Maryland | Paul Sarbanes | Democratic | 1976 | Incumbent re-elected. |
|
| Massachusetts | Ted Kennedy | Democratic | 1962 (special) 1964 1970 1976 |
Incumbent re-elected. |
|
| Michigan | Donald Riegle | Democratic | 1976 1976 (appointed) |
Incumbent re-elected. |
|
| Minnesota | David Durenberger | Republican | 1978 (special) | Incumbent re-elected. |
|
| Mississippi | John C. Stennis | Democratic | 1947 (special) 1952 1958 1964 1970 1976 |
Incumbent re-elected. |
|
| Missouri | John Danforth | Republican | 1976 1976 (appointed) |
Incumbent re-elected. |
|
| Montana | John Melcher | Democratic | 1976 | Incumbent re-elected. |
|
| Nebraska | Edward Zorinsky | Democratic | 1976 1976 (appointed) |
Incumbent re-elected. |
|
| Nevada | Howard Cannon | Democratic | 1958 1964 1970 1976 |
Incumbent lost re-election. Republican gain. |
|
| New Jersey | Nicholas F. Brady | Republican | 1982 (appointed) | Interim appointee retired. Democratic gain. Incumbent resigned December 20, 1982, to give successor preferential seniority. Winner appointed December 27, 1982. |
|
| New Mexico | Harrison Schmitt | Republican | 1976 | Incumbent lost re-election. Democratic gain. |
|
| New York | Daniel Patrick Moynihan | Democratic | 1976 | Incumbent re-elected. |
|
| North Dakota | Quentin Burdick | Democratic-NPL | 1960 (special) 1964 1970 1976 |
Incumbent re-elected. |
|
| Ohio | Howard Metzenbaum | Democratic | 1974 (appointed) 1974 (Lost) 1974 (Resigned) 1976 1976 (appointed) |
Incumbent re-elected. |
|
| Pennsylvania | John Heinz | Republican | 1976 | Incumbent re-elected. |
|
| Rhode Island | John Chafee | Republican | 1976 1976 (appointed) |
Incumbent re-elected. |
|
| Tennessee | Jim Sasser | Democratic | 1976 | Incumbent re-elected. |
|
| Texas | Lloyd Bentsen | Democratic | 1970 1976 |
Incumbent re-elected. |
|
| Utah | Orrin Hatch | Republican | 1976 | Incumbent re-elected. |
Others
|
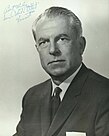
| Vermont | Robert Stafford | Republican | 1971 (appointed) 1972 (special) 1976 |
Incumbent re-elected. |
|
| Virginia | Harry F. Byrd Jr. | Independent | 1965 (appointed)[c] 1966 (special) 1970 1976 |
Incumbent retired. Republican gain. |
|
| Washington | Henry M. Jackson | Democratic | 1952 1958 1964 1970 1976 |
Incumbent re-elected. |
|
| West Virginia | Robert Byrd | Democratic | 1958 1964 1970 1976 |
Incumbent re-elected. |
|
| Wisconsin | William Proxmire | Democratic | 1957 (special) 1958 1964 1970 1976 |
Incumbent re-elected. |
|
| Wyoming | Malcolm Wallop | Republican | 1976 | Incumbent re-elected. |
|
Closest races
In eleven races the margin of victory was under 10%.
| State | Party of winner | Margin |
|---|---|---|
| Missouri | Republican | 1.7% |
| Nevada | Republican (flip) | 2.4% |
| Rhode Island | Republican | 2.4% |
| Virginia | Republican (flip) | 2.4% |
| New Jersey | Democratic (flip) | 3.1% |
| Vermont | Republican | 3.1% [d] |
| Connecticut | Republican | 4.3% |
| Minnesota | Republican | 6.0% |
| California | Republican | 6.7% |
| New Mexico | Democratic (flip) | 7.6% |
| Indiana | Republican | 8.2% |
Arizona
| |||||||||||||||||
 County results DeConcini: 50–60% 60–70% 70–80% 80–90% Dunn: 40–50% | |||||||||||||||||
| |||||||||||||||||
Incumbent Democrat Dennis DeConcini won re-election to a second term over Republican Pete Dunn, State Representative.
| Party | Candidate | Votes | % | ±% | |
|---|---|---|---|---|---|
| Democratic | Dennis DeConcini (Incumbent) | 411,970 | 56.9 | +2.9% | |
| Republican | Peter Dunn | 291,749 | 40.3 | −3.0% | |
| Libertarian | Randall Clamons | 20,100 | 2.8 | +1.8% | |
| Write-ins | 66 | 0 | |||
| Majority | 120,221 | 16.6 | +5.9% | ||
| Turnout | 723,885 | ||||
| Democratic hold | Swing | ||||
California
| |||||||||||||||||
 County results Wilson: 40-50% 50-60% 60-70% 70-80% Brown: 40–50% 50–60% 60–70% | |||||||||||||||||
| |||||||||||||||||
Incumbent Republican S. I. Hayakawa decided to retire after one term. Republican Pete Wilson, mayor of San Diego and former Assemblyman, won the open seat over Democratic Governor Jerry Brown.
Wilson was known as a fiscal conservative who supported Proposition 13, although Wilson had opposed the measure while mayor of San Diego. However, Brown ran on his gubernatorial record of building the largest state budget surpluses in California history. Both Wilson and Brown were moderate-to-liberal on social issues, including support for abortion rights. The election was expected to be close, with Brown holding a slim lead in most of the polls leading up to Election Day. Wilson hammered away at Brown's appointment of California Chief Justice Rose Bird, using this to portray himself as tougher on crime than Brown was. Brown's late entry into the 1980 Democratic presidential primary, after promising not to run, was also an issue. President Ronald Reagan made a number of visits to California late in the race to campaign for Wilson. Reagan quipped that the last thing he wanted to see was one of his home state's U.S. Senate seats falling into Democrats' hands, especially to be occupied by the man who succeeded him as governor. Despite exit polls indicating a narrow Brown victory, Wilson won by a wide margin.
| Party | Candidate | Votes | % | |
|---|---|---|---|---|
| Republican | Pete Wilson | 4,022,565 | 51.5 | |
| Democratic | Jerry Brown | 3,494,968 | 44.8 | |
| Libertarian | Joseph Fuhrig | 107,720 | 1.4 | |
| Peace and Freedom | David Wald | 96,388 | 1.2 | |
| American Independent | Theresa Dietrich | 83,809 | 1.1 | |
| Independent | Thomas Kendall (Write In) | 36 | 0 | |
| Independent | Ben Leonik (Write In) | 34 | 0 | |
| Majority | 527,597 | 6.7 | ||
| Turnout | 7,805,520 | |||
| Republican hold | ||||
Connecticut
| |||||||||||||||||
Weicker: 40–50% 50–60% 60–70% 70–80% Moffett: 40–50% 50–60% 60–70% Tie: 40–50% | |||||||||||||||||
| |||||||||||||||||
Incumbent Republican Lowell P. Weicker Jr. won re-election to a third term over Democratic member of the House Toby Moffett.
| Party | Candidate | Votes | % | |
|---|---|---|---|---|
| Republican | Lowell Weicker (Incumbent) | 545,987 | 50.4 | |
| Democratic | Toby Moffett | 499,146 | 46.1 | |
| Conservative | Lucien DiFazio | 30,212 | 2.8 | |
| Libertarian | James A. Lewis | 8,163 | 0.8 | |
| Majority | 46,841 | 4.3 | ||
| Turnout | 1,083,508 | |||
| Republican hold | ||||
Delaware
| |||||||||||||||||
 County results Roth: 50–60% | |||||||||||||||||
| |||||||||||||||||
Incumbent Republican Bill V. Roth won reelection to a third term over the state's Democratic Insurance Commissioner David N. Levinson.
| Party | Candidate | Votes | % | ±% | |
|---|---|---|---|---|---|
| Republican | Bill V. Roth (Incumbent) | 105,357 | 55.2 | −0.6% | |
| Democratic | David N. Levinson | 84,413 | 44.2 | +0.6% | |
| Libertarian | Lawrence Sullivan | 653 | 0.3 | ||
| American Independent | Charles Baker | 537 | 0.3 | 0% | |
| Majority | 20,944 | 11.0 | −1.2% | ||
| Turnout | 190,960 | ||||
| Republican hold | Swing | ||||
Florida
| |||||||||||||||||
 County results
Chiles: 50–60% 60–70% 70–80% 80–90% Poole: 50–60% 60–70% | |||||||||||||||||
| |||||||||||||||||
Incumbent Democrat Lawton Chiles won re-election to a third term over Republican state senator Van B. Poole.
| Party | Candidate | Votes | % | |
|---|---|---|---|---|
| Democratic | Lawton Chiles (incumbent) | 1,044,246 | 100 | |
| Party | Candidate | Votes | % | |
|---|---|---|---|---|
| Republican | Van B. Poole | 154,163 | 41.6 | |
| Republican | David H. Bludworth | 116,040 | 31.3 | |
| Republican | George Snyder | 100,609 | 27.1 | |
| Total votes | 370,812 | 100 | ||
| Party | Candidate | Votes | % | |
|---|---|---|---|---|
| Republican | Van B. Poole | 131,655 | 58.1 | |
| Republican | David H. Bludworth | 95,035 | 41.9 | |
| Total votes | 226,690 | 100 | ||
| Party | Candidate | Votes | % | ±% | |
|---|---|---|---|---|---|
| Democratic | Lawton Chiles (incumbent) | 1,637,667 | 61.7 | −1.3% | |
| Republican | Van B. Poole | 1,015,330 | 38.3 | +1.2% | |
| Write-ins | 422 | 0 | |||
| Majority | 622,337 | 23.5 | −2.5% | ||
| Total votes | 2,653,419 | 100 | |||
| Democratic hold | Swing | ||||
Hawaii
| |||||||||||||||||
 County results Matsunaga: 70–80% 80–90% | |||||||||||||||||
| |||||||||||||||||
Incumbent Democrat Spark Matsunaga won re-election to a second term[6] over Republican Clarence Brown, a retired Foreign Service officer[7]
| Party | Candidate | Votes | % | |
|---|---|---|---|---|
| Democratic | Spark Matsunaga (Incumbent) | 245,386 | 80.1 | |
| Republican | Clarence Brown | 52,071 | 17.0 | |
| Independent Democrat | E. Bernier-Nachtwey | 8,953 | 2.9 | |
| Majority | 193,315 | 63.1 | ||
| Turnout | 306,410 | |||
| Democratic hold | ||||
Indiana
| |||||||||||||||||
 County results Lugar: 40-50% 50–60% 60–70% 70–80% Fithian: 40–50% 50–60% 60–70% | |||||||||||||||||
| |||||||||||||||||
Incumbent Republican Richard Lugar faced Democratic United States Representative Floyd Fithian in the general election. Lugar won with a margin of 54% of the vote, compared to Fithian's 46%.
After the 1980 census, the Indiana General Assembly redistricted Indiana's congressional districts, pushing Democratic representative Floyd Fithian's district into more conservative territory.[9] After redistricting, Fithian, the three term incumbent of Indiana's 2nd congressional district, decided to run for Secretary of State of Indiana, but withdrew from the primary to ultimately run for the United States Senate. He challenged fellow Democrat and one term Indiana State Senator Michael Kendall of Jasper, Indiana, who Fithian earlier encouraged to run for the Senate.[10] Kendall, who represented Indiana's 47th Senate district and formed the Notre Dame Students for Robert Kennedy organization during the 1968 presidential election,[11] was seen a young progressive alternative to Fithian, who he called the "ideological twin of Richard Lugar."[12] After the bitterly contested primary, Fithian prevailed over Kendall, winning with 59% of the vote.[13]
| Party | Candidate | Votes | % | |
|---|---|---|---|---|
| Democratic | Floyd Fithian | 262,644 | 59.5 | |
| Democratic | Michael Kendall | 178,702 | 40.5 | |
| Total votes | 441,346 | 100 | ||
Incumbent United States Senator Richard Lugar won the republican nomination in an uncontested primary on May 4, 1982.[14]
| Party | Candidate | Votes | % | |
|---|---|---|---|---|
| Republican | Richard Lugar (Incumbent) | 498,248 | 100 | |
| Total votes | 498,248 | |||
In the general election, Lugar faced Fithian and American Party candidate Raymond James.[1]
On November 5, 1982, Lugar defeated Fithian and James in the general election, winning 74 of Indiana's 93 counties.[15]
| Party | Candidate | Votes | % | |
|---|---|---|---|---|
| Republican | Richard Lugar (Incumbent) | 978,301 | 53.8 | |
| Democratic | Floyd Fithian | 828,400 | 45.6 | |
| American | Raymond James | 10,586 | 0.6 | |
| Majority | 149,901 | 8.3 | ||
| Turnout | 1,817,287 | |||
| Republican hold | ||||
Maine
| |||||||||||||||||
 County results Mitchell: 50–60% 60–70% Emery: 50-60% | |||||||||||||||||
| |||||||||||||||||
Incumbent Democrat George J. Mitchell, originally appointed to the seat after Edmund Muskie resigned, won re-election to his full six-year term over Republican U.S. Representative David F. Emery, earning 61% of the vote to Emery's 39%. Mitchell would serve two more terms in the Senate, eventually serving as Senate Majority Leader.
| Party | Candidate | Votes | % | |
|---|---|---|---|---|
| Democratic | George J. Mitchell (Incumbent) | 279,819 | 60.9 | |
| Republican | David F. Emery | 179,882 | 39.1 | |
| None | Write-Ins | 14 | 0 | |
| Majority | 99,937 | 21.7 | ||
| Turnout | 459,715 | |||
| Democratic hold | ||||
Maryland
| |||||||||||||||||
 County results Sarbanes: 50–60% 60–70% 80–90% | |||||||||||||||||
| |||||||||||||||||
Incumbent Democrat Paul Sarbanes won re-election to a second term in office. He defeated the Republican former Representative from Maryland's 5th district and Prince George's County Executive Lawrence Hogan.[16]
| Party | Candidate | Votes | % | |
|---|---|---|---|---|
| Democratic | Paul Sarbanes (Incumbent) | 707,356 | 63.5 | |
| Republican | Lawrence Hogan | 407,334 | 36.5 | |
| Majority | 300,022 | 26.9 | ||
| Turnout | 1,114,690 | |||
| Democratic hold | ||||
Massachusetts
| |||||||||||||||||
County results Kennedy: 40–50% 50–60% 60–70% 70–80% 80–90% 90–100% Shamie: 40–50% 50–60% 60–70% 70–80% | |||||||||||||||||
| |||||||||||||||||
Incumbent Democrat Ted Kennedy won re-election to his fifth (his fourth full) term over Republican Ray Shamie, a millionaire businessman and metalwork entrepreneur.
| Party | Candidate | Votes | % | ±% | |
|---|---|---|---|---|---|
| Democratic | Ted Kennedy (Incumbent) | 1,247,084 | 60.8 | −8.5 | |
| Republican | Ray Shamie | 784,602 | 38.3 | +9.3 | |
| Libertarian | Howard S. Katz | 18,878 | 0.9 | +0.9 | |
| All others | 205 | 0 | 0 | ||
| Total votes | 2,050,769 | 70.3% | |||
| Majority | 462,482 | 22.6% | |||
| Democratic hold | Swing | ||||
Michigan
| |||||||||||||||||
 County results Riegle: 50–60% 60–70% 70–80% Ruppe: 50–60% 60–70% | |||||||||||||||||
| |||||||||||||||||
Incumbent Democrat Don Riegle won re-election to a second term, defeating Republican challenger Philip Ruppe, a former U.S. Representative from Houghton.
| Party | Candidate | Votes | % | |
|---|---|---|---|---|
| Democratic | Donald Riegle (incumbent) | 1,728,793 | 57.7 | |
| Republican | Philip Ruppe | 1,223,288 | 40.9 | |
| Libertarian | Bette Erwin | 19,131 | 0.6 | |
| American Independent | Daniel Eller | 12,660 | 0.4 | |
| Workers League | Helen Halyard | 6,085 | 0.2 | |
| Socialist Workers | Steve Beumer | 4,335 | 0.1 | |
| None | Write-Ins | 42 | 0 | |
| Majority | 505,505 | 16.9 | ||
| Turnout | 2,994,334 | |||
| Democratic hold | ||||
Minnesota
| |||||||||||||||||
 County results Durenberger: 40–50% 50–60% 60–70% Dayton: 50–60% 60–70% | |||||||||||||||||
| |||||||||||||||||
Incumbent Republican David Durenberger won re-election to his second term over Democratic businessman Mark Dayton.[17]

| Party | Candidate | Votes | % | |
|---|---|---|---|---|
| Democratic | Mark Dayton | 359,014 | 69.1 | |
| Democratic | Eugene McCarthy | 125,229 | 24.1 | |
| Democratic | Charles E. Pearson | 19,855 | 3.8 | |
| Democratic | William A. Branstner | 15,754 | 3.0 | |
Dayton, 35, self-financed his campaign. Married to a Rockefeller and heir to a department store, his net worth was an estimated $30 million. Durenberger, who in 1978 and won the special election to finish the term of the late Hubert Humphrey, was largely unknown. He was considered a moderate, but supported Reagan's tax cuts. Dayton ran against Reaganomics. He has also campaigned against tax breaks for the wealthy and even promised "to close tax loopholes for the rich and the corporations—and if you think that includes the Daytons, you're right."[18] By the end of September, the senate election already became the most expensive election of all time, with over $8 million being spent. Dayton spent over $5 million,[19] while Durenberger spent over $2 million.[20]
| Party | Candidate | Votes | % | |
|---|---|---|---|---|
| Republican | David Durenberger (Incumbent) | 949,207 | 52.6 | |
| Democratic | Mark Dayton | 840,401 | 46.6 | |
| Socialist Workers | Bill Onasch | 5,897 | 0.3 | |
| Libertarian | Frederick Hewitt | 5,870 | 0.3 | |
| New Union Party | Jeffrey M. Miller | 3,300 | 0.2 | |
| Majority | 108,806 | 6.0 | ||
| Turnout | 1,804,675 | |||
| Republican hold | ||||
Mississippi
| |||||||||||||||||
 County results Stennis: 50–60% 60–70% 70–80% 80–90% >90% Barbour: 50–60% | |||||||||||||||||
| |||||||||||||||||
Incumbent Democrat John C. Stennis won re-election to his seventh term over Republican Haley Barbour, a political operative who campaigned for U.S. Presidents Richard Nixon and Gerald Ford.
| Party | Candidate | Votes | % | |
|---|---|---|---|---|
| Democratic | John Stennis (Incumbent) | 414,099 | 64.2 | |
| Republican | Haley Barbour | 230,927 | 35.8 | |
| Majority | 184,172 | 28.4 | ||
| Turnout | 645,026 | |||
| Democratic hold | ||||
Missouri
| |||||||||||||||||
 County Results Danforth: 50-60% 60-70% | |||||||||||||||||
| |||||||||||||||||
Incumbent John Danforth, originally elected in the 1976 United States Senate election in Missouri, ran for a second term. In the general election, he narrowly defeated state senator Harriett Woods by just over a percentage point. Danforth would go on to serve two more terms in the Senate.
| Party | Candidate | Votes | % | |
|---|---|---|---|---|
| Republican | John Danforth (Incumbent) | 784,876 | 50.9 | |
| Democratic | Harriett Woods | 758,629 | 49.2 | |
| None | Write-Ins | 16 | 0 | |
| Majority | 26,247 | 1.7 | ||
| Turnout | 1,543,521 | |||
| Republican hold | ||||
Montana
| |||||||||||||||||
 County results Melcher: 40–50% 50–60% 60–70% 70–80% Williams: 40–50% 50–60% | |||||||||||||||||
| |||||||||||||||||
Incumbent John Melcher, who was first elected to the Senate in 1976, opted to run for re-election. He won the Democratic primary after he faced a tough intraparty challenger, and advanced to the general election, where he faced Larry R. Williams, an author and the Republican nominee, and Larry Dodge, the Libertarian nominee. Though his margin was reduced significantly from his initial election, Melcher still comfortably won re-election to his second and final term in the Senate.
During his first term in the Senate, Melcher's relative conservatism for a Democrat prompted a primary challenger in Michael Bond, a housing contractor who campaigned on his opposition to nuclear war. Bond attacked Melcher for voting to increase spending on nuclear arms, and pledged to reduce military spending to $60 billion and to use the savings to reduce interest rates.[22] During the campaign, Bond came under fire from the state branches of the Veterans of Foreign Wars and the Disabled American Veterans for turning in his draft card in 1967 to protest the Vietnam War, who put out a statement, saying, "There is no place in the U.S. Senate for any draft dodger, draft card burner or draft protester of any kind."[23]
| Party | Candidate | Votes | % | |
|---|---|---|---|---|
| Democratic | Jack Melcher (Incumbent) | 83,539 | 68.3 | |
| Democratic | Mike Bond | 33,565 | 27.4 | |
| Total votes | 122,369 | 100 | ||
| Party | Candidate | Votes | % | |
|---|---|---|---|---|
| Republican | Larry R. Williams | 49,615 | 88.1 | |
| Republican | Willie Dee Morris | 6,696 | 11.9 | |
| Total votes | 56,311 | 100 | ||
| Party | Candidate | Votes | % | ±% | |
|---|---|---|---|---|---|
| Democratic | John Melcher (Incumbent) | 174,861 | 54.5 | −9.7% | |
| Republican | Larry R. Williams | 133,789 | 41.7 | +5.8% | |
| Libertarian | Larry Dodge | 12,412 | 3.9 | ||
| Majority | 41,072 | 12.8 | −15.5% | ||
| Turnout | 321,062 | ||||
| Democratic hold | Swing | ||||
Nebraska
| |||||||||||||||||
 County results Zorinsky: 40–50% 50–60% 60–70% 70–80% Keck: 40–50% 50–60% Tie: 40–50% | |||||||||||||||||
| |||||||||||||||||
Incumbent Democrat Edward Zorinsky won re-election.
| Party | Candidate | Votes | % | |
|---|---|---|---|---|
| Democratic | Edward Zorinsky (incumbent) | 363,350 | 66.6 | |
| Republican | Jim Keck | 155,760 | 28.6 | |
| Independent | Virginia Walsh | 26,443 | 4.9 | |
| None | Write-Ins | 94 | 0 | |
| Majority | 207,590 | 38.0 | ||
| Turnout | 545,647 | |||
| Democratic hold | ||||
Nevada
| |||||||||||||||||
 County results Hecht: 40–50% 50–60% 60–70% Cannon: 50–60% | |||||||||||||||||
| |||||||||||||||||
Incumbent Democrat Howard Cannon ran for re-election to a fifth term, but lost to Republican State Senator Chic Hecht.
| Party | Candidate | Votes | % | |
|---|---|---|---|---|
| Republican | Chic Hecht | 120,377 | 50.1 | |
| Democratic | Howard Cannon (Incumbent) | 114,720 | 47.7 | |
| None of These Candidates | – | 5,297 | 2.2 | |
| Majority | 15,657 | 2.4 | ||
| Turnout | 240,394 | |||
| Republican gain from Democratic | ||||
New Jersey
| |||||||||||||||||
 Lautenberg: 50–60% 60–70% 70–80%
Fenwick: 40–50% 50–60% 60–70% | |||||||||||||||||
| |||||||||||||||||
Democrat Frank Lautenberg won for the seat held by retiring incumbent Republican Senator Nicholas Brady. Lautenberg won the seat with a margin of 3.2% over member of the House Millicent Fenwick.
Cresitello dropped out of the race on May 27 but remained on the June 8 primary ballot.[26]
| Party | Candidate | Votes | % | |
|---|---|---|---|---|
| Democratic | Frank Lautenberg | 104,666 | 26.0 | |
| Democratic | Andrew Maguire | 92,878 | 23.1 | |
| Democratic | Joseph A. LeFante | 81,440 | 20.2 | |
| Democratic | Barbara Boggs Sigmund | 45,708 | 11.3 | |
| Democratic | Howard Rosen | 28,427 | 7.1 | |
| Democratic | Angelo Bianchi | 17,684 | 4.4 | |
| Democratic | Cyril Yannarelli | 10,188 | 2.5 | |
| Democratic | Frank Forst | 9,563 | 2.4 | |
| Democratic | Richard D. McAleer | 8,110 | 2.0 | |
| Democratic | Donald Cresitello | 4,295 | 1.1 | |
| Total votes | 402,959 | 100 | ||
| Party | Candidate | Votes | % | |
|---|---|---|---|---|
| Republican | Millicent Fenwick | 193,683 | 54.3 | |
| Republican | Jeff Bell | 163,145 | 45.7 | |
| Total votes | 356,828 | 100 | ||
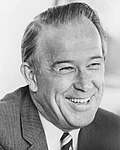
The seat had been occupied by Democrat Harrison A. Williams, who resigned on March 11, 1982, after being implicated in the Abscam scandal. After Williams' resignation, Republican Governor Thomas Kean appointed Republican Nicholas F. Brady to the seat. Brady served in the Senate through the primary and general elections but did not run for the seat himself.
In the general election, Lautenberg faced popular Republican member of the House Millicent Fenwick. She ran on a very progressive platform and polls in the Summer of 1982 put her ahead by 18 points. Even Lautenberg quipped that she was "the most popular candidate in the country."[28] Lautenberg spent more of his own money, eventually out-spending Fenwick two-to-one. He emphasised President Reagan's unpopularity, reminded the voters that she would be a vote for a Republican majority in the Senate and called Fenwick, who was 72, "eccentric" and "erratic" but denied that he was referring to her age.[28][29] He did however point out that she would be almost 80 at the end of her first term and was therefore unlikely to gain much seniority in the Senate.[28] Coincidentally, the age issue would be used against Lautenberg in his own re-election bid in 2008.
Lautenberg won by 51% to 48%, in what was considered a major upset.[28] Brady, who had just a few days left in his appointed term, resigned on December 27, 1982, allowing Lautenberg to take office several days before the traditional swearing-in of senators, which gave him an edge in seniority over the other freshman senators.
| Party | Candidate | Votes | % | ||
|---|---|---|---|---|---|
| Democratic | Frank Lautenberg | 1,117,549 | 50.9 | ||
| Republican | Millicent Fenwick | 1,047,626 | 47.8 | ||
| Libertarian | Henry Koch | 9,934 | 0.5 | ||
| Socialist Labor | Julius Levin | 5,580 | 0.3 | ||
| Independent | Martin E. Wendelken | 4,745 | 0.2 | ||
| Socialist Workers | Claire Moriarty | 3,726 | 0.2 | ||
| Grassroots | Robert T. Bastien | 2,955 | 0.1 | ||
| Repeal TF 807 | Rose Zeidwerg Monyek | 1,830 | 0.1 | ||
| Majority | 69.923 | 3.2 | |||
| Turnout | 2,193,945 | 100 | |||
| Democratic gain from Republican | Swing | ||||
New Mexico
| |||||||||||||||||
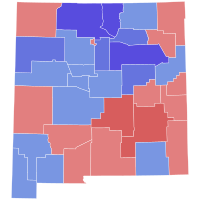 County results Bingaman: 50–60% 60–70% 70–80% Schmitt: 50–60% 60–70% | |||||||||||||||||
| |||||||||||||||||
Incumbent Republican Harrison Schmitt was running for re-election to a second term, but lost to Democrat Jeff Bingaman, Attorney General of New Mexico.
| Party | Candidate | Votes | % | ±% | |
|---|---|---|---|---|---|
| Democratic | Jeff Bingaman | 217,682 | 53.8 | +11.1% | |
| Republican | Harrison Schmitt (Incumbent) | 187,128 | 46.2 | −10.6% | |
| Majority | 30,554 | 7.6 | −6.6% | ||
| Turnout | 404,810 | ||||
| Democratic gain from Republican | Swing | ||||
New York
| |||||||||||||||||
 County results Moynihan: 40–50% 50–60% 60–70% 70–80% 80–90% Sullivan: 40–50% 50–60% | |||||||||||||||||
| |||||||||||||||||
Incumbent Democrat Daniel Patrick Moynihan won re-election to a second term over Republican Assemblywoman Florence Sullivan.
| Party | Candidate | Votes | % | |
|---|---|---|---|---|
| Democratic | Daniel Patrick Moynihan (Incumbent) | 3,232,146 | 65.1 | |
| Republican | Florence Sullivan | 1,696,766 | 34.2 | |
| Libertarian | James J. McKeown | 23,379 | 0.5 | |
| Socialist Workers | Steven Wattenmaker | 15,206 | 0.5 | |
| None | Write-Ins | 232 | 0 | |
| Majority | 1,535,380 | 30.9 | ||
| Turnout | 4,967,729 | |||
| Democratic hold | ||||
North Dakota
| |||||||||||||||||
 County results Burdick: 40–50% 50–60% 60–70% 70–80% Knorr: 40–50% 50–60% | |||||||||||||||||
| |||||||||||||||||
The incumbent, North Dakota Democratic NPL Party (Dem-NPL) Quentin Burdick, sought and received re-election to his fifth term, defeating Republican candidate Gene Knorr.[1]
Only Burdick filed as a Dem-NPLer, and the endorsed Republican candidate was cattle rancher Gene Knorr. Burdick and Knorr won the primary elections for their respective parties. Burdick's campaign was known for employing more television advertisement spending when compared with his campaigns in the past, as well as making several negative portrayals. Knorr had the support of Vice President George H. W. Bush, who campaigned in state to support his candidacy. The election was also noted as the first where Burdick's age began to become an issue. Burdick, who was 74 during the year of the election, faced a much younger Knorr, who was 41. At one point, Burdick challenged Knorr to a fistfight to prove his vitality; but the challenge, assumed to be a joke, never occurred. After being defeated, Knorr moved to Washington, D.C., where he took the position of staff vice president with Philip Morris International.
One independent candidate, Anna B. Bourgois, also filed before the deadline, running under her self-created party titled God, Family, and Country. Bourgois would later run for North Dakota's other United States Senate seat as an independent in 1986, challenging Mark Andrews. She received over 8,000 votes in the election, which is rather high for an independent. Some attribute her large number of votes to the name of her party – which was based on things that North Dakotans valued. Despite the result, Bourgois' campaign still had little impact on the outcome.
| Party | Candidate | Votes | % | |
|---|---|---|---|---|
| Democratic | Quentin Burdick (Incumbent) | 164,873 | 62.8 | |
| Republican | Gene Knorr | 89,304 | 34.0 | |
| Independent | Anna B. Bourgois | 8,288 | 3.1 | |
| Majority | 75,569 | 28.8 | ||
| Turnout | 262,465 | |||
| Democratic hold | ||||
Prior to the 1982 Senate campaign, Knorr had been working in Washington, DC since 1970 when he worked for the Department of Treasury. He began working in Washington, DC, residing in McLean, Virginia after receiving a Juris Doctorate from Northwestern University where he was celebrated in debate. From Treasury, he worked as a lobbyist with Charls E. Walker Associates.
Ohio
| |||||||||||||||||
 County Results Metzenbaum: 50–60% 60–70% 70–80% Pfeifer: 50-60% 60-70% | |||||||||||||||||
| |||||||||||||||||
Incumbent Democrat Howard Metzenbaum successfully sought re-election to his third term, defeating Republican State Senator from Bucyrus Paul Pfeifer.
| Party | Candidate | Votes | % | |
|---|---|---|---|---|
| Democratic | Howard Metzenbaum (Incumbent) | 1,923,767 | 56.7 | |
| Republican | Paul Pfeifer | 1,396,790 | 41.1 | |
| Independent | Alicia Merel | 38,803 | 1.1 | |
| Libertarian | Philip Herzing | 36,103 | 1.1 | |
| Majority | 526,977 | 15.5 | ||
| Turnout | 3,395,463 | |||
| Democratic hold | ||||
Pennsylvania
| |||||||||||||||||
 County results Heinz: 50–60% 60–70% 70–80% Wecht: 50–60% 60–70% | |||||||||||||||||
| |||||||||||||||||
Incumbent Republican H. John Heinz III successfully sought re-election to another term, defeating Democratic nominee Cyril Wecht, member of the Allegheny County Board of Commissioners.
John Heinz's Democratic opponent in the 1982 election was Allegheny County commissioner and former coroner Cyril Wecht, who lacked significant name recognition outside of Pittsburgh, his home town. Although the 1982 elections were a setback nationally for incumbent President Ronald Reagan and the Republican Party, neither Heinz nor incumbent Republican governor Dick Thornburgh, who was also up for re-election in 1982, were challenged by Democrats with statewide prominence. Wecht ran a low-budget campaign lacking the assets to boost his name recognition; The Philadelphia Inquirer ran a headline dubbing the race "The Race for Senator No One Seemed to Notice."[32] Despite this, Heinz ran a cautious campaign, running as a moderate due to Pennsylvania's unemployment, 11%, one of the highest in the nation at the time, as well as the declining health of Pennsylvania's coal mining, manufacturing and steel industries. In the end, Heinz won the election by a wide margin, winning 59.3% of the popular vote. Wecht won 39.2% of the popular vote.[32]
| Party | Candidate | Votes | % | ±% | |
|---|---|---|---|---|---|
| Republican | H. John Heinz III (Incumbent) | 2,136,418 | 59.3 | +6.9% | |
| Democratic | Cyril Wecht | 1,412,965 | 39.2 | −7.6% | |
| Libertarian | Barbara I. Karkutt | 19,244 | 0.5 | +0.5% | |
| Socialist Workers | William H. Thomas | 18,951 | 0.5 | +0.4% | |
| Consumer | Liane Norman | 16,530 | 0.5 | +0.5% | |
| Majority | 723,453 | 20.1 | +14.5% | ||
| Turnout | 3,604,108 | ||||
| Republican hold | Swing | ||||
Rhode Island
| |||||||||||||||||
Chafee: 50–60% 60–70% 70–80% Michaelson: 50–60% 60–70% | |||||||||||||||||
| |||||||||||||||||
Incumbent Republican John Chafee successfully sought re-election to a second term, defeating Democrat Julius C. Michaelson, former Attorney General of Rhode Island.
| Party | Candidate | Votes | % | |
|---|---|---|---|---|
| Democratic | Julius C. Michaelson | 56,800 | 82.4 | |
| Democratic | Helen E. Flynn | 12,159 | 17.6 | |
| Majority | 44,641 | 64.7 | ||
| Total votes | 68,959 | 100 | ||
| Party | Candidate | Votes | % | |
|---|---|---|---|---|
| Republican | John Chafee (Incumbent) | 175,495 | 51.2 | |
| Democratic | Julius C. Michaelson | 167,283 | 48.8 | |
| Majority | 8,212 | 2.4 | ||
| Total votes | 342,778 | 100 | ||
| Republican hold | ||||
Tennessee
| |||||||||||||||||
 County results Sasser: 50–60% 60–70% 70–80% 80–90% Beard: 50–60% | |||||||||||||||||
| |||||||||||||||||
Democrat Jim Sasser was re-elected with 61.9% of the vote, over Republican Robin Beard, a member of the U.S. House of Representatives.
| Party | Candidate | Votes | % | |
|---|---|---|---|---|
| Democratic | Jim Sasser (Incumbent) | 780,113 | 61.9 | |
| Republican | Robin Beard | 479,642 | 38.1 | |
| Majority | 300,471 | 23.9 | ||
| Turnout | 1,259,755 | |||
| Democratic hold | ||||
Texas
| |||||||||||||||||
 County results Bentsen: 50–60% 60–70% 70–80% 80–90% Collins: 50–60% 60–70% | |||||||||||||||||
| |||||||||||||||||
Incumbent Democrat Lloyd Bentsen successfully ran for re-election to his third term, defeating Republican U.S. Representative James M. Collins.
Democratic incumbent, Lloyd Bentsen, won re-election.
| Party | Candidate | Votes | % | |
|---|---|---|---|---|
| Democratic | Lloyd Bentsen (Incumbent) | 1,818,223 | 58.6 | |
| Republican | James M. Collins | 1,256,759 | 40.5 | |
| Libertarian | John E. Ford | 23,494 | 0.8 | |
| Citizens | Lineaus Hooper Lorette | 4,564 | 0.2 | |
| None | Write-Ins | 127 | 0 | |
| Majority | 561,464 | 18.1 | ||
| Turnout | 3,103,167 | |||
| Democratic hold | ||||
Utah
| |||||||||||||||||
 County results Hatch: 50-60% 60-70% 70-80% 80-90% Wilson: 50–60% 60–70% | |||||||||||||||||
| |||||||||||||||||
Incumbent Republican Orrin Hatch successfully ran for re-election to his second term, defeating Democrat mayor of Salt Lake City Ted Wilson.
| Party | Candidate | Votes | % | |
|---|---|---|---|---|
| Republican | Orrin Hatch (Incumbent) | 309,332 | 58.3 | |
| Democratic | Ted Wilson | 219,482 | 41.4 | |
| Libertarian | George Mercier | 1,035 | 0.2 | |
| American | Lawrence R. Kauffman | 953 | 0.2 | |
| Majority | 89,850 | 16.9 | ||
| Turnout | 530,802 | |||
| Republican hold | ||||
Vermont
| |||||||||||||||||
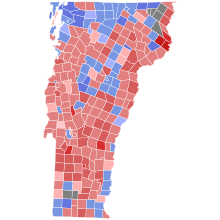
Stafford: 30-40% 40-50% 50-60% 60-70% 70-80% 80-90% Guest: 40-50% 50-60% 60-70% | |||||||||||||||||
| |||||||||||||||||
Incumbent Republican Robert Stafford successfully ran for re-election to another term in the United States Senate, defeating Democratic candidate James A. Guest.
| Party | Candidate | Votes | % | |
|---|---|---|---|---|
| Republican | Robert Stafford (Incumbent) | 26,323 | 46.2 | |
| Republican | Stewart M. Ledbetter | 19,743 | 34.7 | |
| Republican | John McClaughry | 10,692 | 18.8 | |
| Republican | Other | 162 | 0.3 | |
| Total votes | '65,920' | '100' | ||
| Party | Candidate | Votes | % | |
|---|---|---|---|---|
| Democratic | James A. Guest | 11,352 | 67.1 | |
| Democratic | Thomas E. McGregor | 3,749 | 22.2 | |
| Democratic | Earl S. Gardner | 1,281 | 7.6 | |
| Democratic | Other | 536 | 3.2 | |
| Total votes | '16,918' | '100' | ||
| Party | Candidate | Votes | % | |
|---|---|---|---|---|
| Republican | Robert Stafford (Incumbent) | 84,450 | 50.3 | |
| Democratic | James A. Guest | 79,340 | 47.2 | |
| Independent | Michael Edward Hackett | 1,463 | 1.0 | |
| Independent | Ion Laskaris | 897 | 0.5 | |
| Libertarian | Bo Adlerbert | 892 | 0.5 | |
| N/A | Other | 961 | 0.6 | |
| Total votes | 168,003 | '100' | ||
| Majority | 5,109 | 3.0 | ||
| Republican hold | ||||
Virginia
| Turnout | 35.7% (voting eligible)[38] | ||||||||||||||||
|---|---|---|---|---|---|---|---|---|---|---|---|---|---|---|---|---|---|
| |||||||||||||||||
 County and independent city results Trible: 50–60% 60–70% 80–90% Davis: 50–60% 60–70% 70–80% | |||||||||||||||||
| |||||||||||||||||
U.S. Representative from Virginia's 1st district, Paul Trible replaced Independent Senator Harry F. Byrd Jr., who was stepping down after three terms. He beat Democratic Lieutenant Governor of Virginia, Richard Joseph Davis.
| Party | Candidate | Votes | % | ±% | |
|---|---|---|---|---|---|
| Republican | Paul Trible | 724,571 | 51.2 | +51.2% | |
| Democratic | Dick Davis | 690,839 | 48.8 | +10.5% | |
| Write-ins | 212 | 0 | |||
| Majority | 33,732 | 2.4 | −16.6% | ||
| Turnout | 1,415,622 | ||||
| Republican gain from Independent | Swing | ||||
Washington
| |||||||||||||||||||||
 County results Jackson: 40-50% 60-70% 70-80% | |||||||||||||||||||||
| |||||||||||||||||||||
Incumbent Democrat Henry M. Jackson successfully ran for re-election to his sixth and final term, defeating Republican challenger Doug Jewett, a Seattle City Attorney and independent King Lysen, a state senator.
| Party | Candidate | Votes | % | |
|---|---|---|---|---|
| Democratic | Henry M. Jackson (Incumbent) | 943,655 | 69.0 | |
| Republican | Doug Jewett | 332,273 | 24.3 | |
| Independent | King Lysen | 72,297 | 5.3 | |
| Independent | Jesse Chiang | 20,251 | 1.5 | |
| Majority | 611,382 | 44.7 | ||
| Turnout | 1,368,476 | |||
| Democratic hold | ||||
West Virginia
| |||||||||||||||||
 County results Byrd: 40–50% 50–60% 60–70% 70–80% 80–90% Benedict: 50–60% | |||||||||||||||||
| |||||||||||||||||
Incumbent Democrat Robert Byrd won re-election to a fifth term over Republican Cleve Benedict, a freshman member of the House.
Benedict made great note of Byrd's record of high office in the Ku Klux Klan, his avoidance of service in World War II, and the fact that Byrd, then alone among members of Congress, owned no home in the state he represented. His campaign represented the last serious and well-funded effort to unseat Byrd, spending $1,098,218. Byrd was Minority Leader at the time.
| Party | Candidate | Votes | % | |
|---|---|---|---|---|
| Democratic | Robert Byrd (Incumbent) | 387,170 | 68.5 | |
| Republican | Cleve Benedict | 173,910 | 30.8 | |
| Majority | 213,260 | 37.7 | ||
| Turnout | 565,314 | |||
| Democratic hold | ||||
Wisconsin
| |||||||||||||||||
 County results Proxmire: 40–50% 50–60% 60–70% 70–80% 80–90% McCallum: 50-60% | |||||||||||||||||
| |||||||||||||||||
Incumbent Democrat William Proxmire successfully ran for re-election to his fifth and final term, defeating Republican States Representative Scott McCallum.
| Party | Candidate | Votes | % | |
|---|---|---|---|---|
| Democratic | William Proxmire (Incumbent) | 983,311 | 63.7 | |
| Republican | Scott McCallum | 527,355 | 34.1 | |
| Labor–Farm | William Osborne Hart | 21,807 | 1.4 | |
| Libertarian | George Liljenfeldt | 7,947 | 0.5 | |
| Constitution | Sanford G. Knapp | 4,463 | 0.29 | |
| Majority | 455,956 | 29.5 | ||
| Turnout | 1,544,883 | |||
| Democratic hold | ||||
Wyoming
| |||||||||||||||||
 County Results Wallop: 50-60% 60-70% 70-80% McDaniel: 50–60% | |||||||||||||||||
| |||||||||||||||||
Incumbent Republican U.S. Senator Malcolm Wallop was re-elected to a second term in office, defeating Democratic State Senator Rodger McDaniel.
| Party | Candidate | Votes | % | |
|---|---|---|---|---|
| Republican | Malcolm Wallop (Incumbent) | 94,725 | 56.7 | |
| Democratic | Rodger McDaniel | 72,466 | 43.3 | |
| Majority | 22,259 | 13.3 | ||
| Turnout | 167,191 | |||
| Republican hold | ||||
See also
Notes
References
- ^ a b c d e f g h i j k l m n o p q r s t u v w Clerk of the United States House of Representatives (1983). "Statistics of the Congressional Election of November 2, 1982" (PDF). United States Government Printing Office. Archived (PDF) from the original on July 21, 2011. Retrieved September 22, 2017.
- ^ "CA US Senate Race - Nov 02, 1982". Our Campaigns. Archived from the original on September 22, 2017. Retrieved December 20, 2017.
- ^ "CT US Senate Race - Nov 02, 1982". Our Campaigns. Archived from the original on September 22, 2017. Retrieved December 20, 2017.
- ^ "Florida Department of State - Election Results". Archived from the original on July 18, 2011. Retrieved March 29, 2011.
- ^ "Florida Department of State - Election Results". Archived from the original on July 18, 2011. Retrieved March 29, 2011.
- ^ "HI US Senate Race - Nov 08, 1988". Our Campaigns. Archived from the original on September 22, 2017. Retrieved December 20, 2017.
- ^ "Eugene Register-Guard - Google News Archive Search". news.google.com. Retrieved December 20, 2017.
- ^ "HI US Senate Race - Nov 02, 1982". Our Campaigns. Archived from the original on September 22, 2017. Retrieved December 20, 2017.
- ^ "Floyd Fithian, 76; Congressman, Farmer, Purdue Professor". Los Angeles Times. July 4, 2003. Archived from the original on March 18, 2014. Retrieved February 22, 2013.
- ^ Associated Press (May 5, 1982). "Senate Candidates Chosen in Indiana". Toledo Blade. Retrieved February 22, 2013.
- ^ Ray E. Boomhower (2008). Robert F. Kennedy and the 1968 Indiana Primary. Indiana University Press. ISBN 9780253007759. Retrieved February 22, 2013.
- ^ "Senate Candidates Chosen in Indiana". Toledo Blade. Associated Press. May 5, 1982. Retrieved February 22, 2013.
- ^ "IN US Senate- D Primary". ourcampaigns.com. June 13, 2005. Archived from the original on November 12, 2012. Retrieved February 22, 2013.
- ^ Monica Davey (April 17, 2012). "Once Every 36 Years, Primary Fight for Indiana Senator". The New York Times. Archived from the original on September 23, 2017. Retrieved February 22, 2013.
- ^ "IN US Senate". ourcampaigns.com. June 15, 2011. Archived from the original on August 20, 2016. Retrieved February 22, 2013.
- ^ "Election and voting information". FEC.gov. Archived (PDF) from the original on May 6, 2017. Retrieved February 11, 2022.
- ^ "MN US Senate Race - Nov 02, 1982". Our Campaigns. Archived from the original on September 8, 2017. Retrieved December 20, 2017.
- ^ "Senators: Questions About Campaign Spending". TIME. September 27, 1982. Archived from the original on October 15, 2010. Retrieved December 20, 2017.
- ^ "Lodi News-Sentinel - Google News Archive Search". news.google.com. Retrieved December 20, 2017.
- ^ "The Milwaukee Sentinel - Google News Archive Search". news.google.com. Retrieved December 20, 2017.[permanent dead link]
- ^ "MS US Senate Race - Nov 02, 1982". Our Campaigns. Archived from the original on September 22, 2017. Retrieved December 20, 2017.
- ^ "Melcher Faces Difficult Test in Montana's Senate Primary". The New York Times. June 6, 1982. Archived from the original on July 15, 2014. Retrieved July 2, 2014.
- ^ "Vets ask draft-protesting candidate to call it quits". The Spokesman-Review. May 31, 1982. Retrieved July 2, 2014.
- ^ a b "Report of the Official Canvass of the Vote Cast at the Primary Election Held in the State of Montana, June 1, 1976". Montana Secretary of State. Retrieved July 2, 2014.
- ^ "NV US Senate Race - Nov 02, 1982". Our Campaigns. Archived from the original on September 22, 2017. Retrieved December 20, 2017.
- ^ "Cresitello Quits Jersey Senate Race". The New York Times. May 28, 1982. Archived from the original on August 13, 2016. Retrieved June 25, 2016.
TRENTON, May 27— Former Mayor Donald Cresitello of Morristown withdrew today from the race for the Democratic nomination for United States Senator and endorsed former Representative Joseph A. LeFante of Bayonne.
- ^ a b "Republican and Democratic Candidates for the Office of United States Senator" (PDF). Secretary of State of New Jersey. 1982. Archived (PDF) from the original on July 7, 2016. Retrieved June 25, 2016.
- ^ a b c d Kornacki, Steve (January 14, 2013). "When Lautenberg's Age Met Booker's Ambition: An Elegy for the Swamp Dog". Capital New York. Archived from the original on January 19, 2013. Retrieved June 5, 2013.
- ^ Arnold, Laurence (June 3, 2013). "Frank Lautenberg, U.S. Senator From New Jersey, Dies at 89". Bloomberg News. Archived from the original on June 7, 2013. Retrieved June 6, 2013.
- ^ "Votes Cast for the Office of United States Senator" (PDF). Secretary of State of New Jersey. 1982. Archived (PDF) from the original on July 7, 2016. Retrieved June 25, 2016.
- ^ "NY US Senate Race - Nov 02, 1982". Our Campaigns. Archived from the original on September 22, 2017. Retrieved December 20, 2017.
- ^ a b Lamis, Renée M. (2009). The realignment of Pennsylvania politics since 1960 : two-party competition in a battleground state. Foreword by James L. Sundquist. University Park, Pa.: Pennsylvania State University Press. p. 109. ISBN 978-0271034195.
- ^ "RI US Senate - D Primary". OurCampaigns. Archived from the original on March 18, 2014. Retrieved March 17, 2014.
- ^ "RI US Senate". OurCampaigns. Archived from the original on March 18, 2014. Retrieved March 17, 2014.
- ^ Cook, Rhodes (2017). America Votes 32: 2015–2016, Election Returns by State. CQ Press. ISBN 9781506368993. Archived from the original on November 7, 2020. Retrieved February 11, 2019 – via Google Books.
- ^ a b "Primary Election Results" (PDF). Office of the Vermont Secretary of State. Archived from the original (PDF) on December 31, 2014. Retrieved June 15, 2015.
- ^ "General Election Results - U.S. Senator - 1914-2014" (PDF). Office of the Vermont Secretary of State. Archived from the original (PDF) on March 4, 2016. Retrieved June 15, 2015.
- ^ Dr. Michael McDonald (March 25, 2013). "Turnout 1980-2012". George Mason University. Archived from the original on October 30, 2012. Retrieved April 3, 2013.
- ^ "WV US Senate Race - Nov 02, 1982". Our Campaigns. Archived from the original on October 19, 2012. Retrieved September 8, 2013.

