West Antarctic ice sheet
78°44′03″S 133°16′41″W / 78.73417°S 133.27806°W
| West Antarctic ice sheet | |
|---|---|
 | |
| Type | Ice sheet |
| Area | <1,970,000 km2 (760,000 sq mi)[1] |
| Thickness | ~1.05 km (0.7 mi) (average),[2] ~2 km (1.2 mi) (maximum) [1] |
The Western Antarctic Ice Sheet (WAIS) is the segment of the continental ice sheet that covers West Antarctica, the portion of Antarctica on the side of the Transantarctic Mountains that lies in the Western Hemisphere. It is classified as a marine-based ice sheet, meaning that its bed lies well below sea level and its edges flow into floating ice shelves. The WAIS is bounded by the Ross Ice Shelf, the Ronne Ice Shelf, and outlet glaciers that drain into the Amundsen Sea.[1]
As a smaller part of Antarctica, WAIS is also more strongly affected by climate change. There has been warming over the ice sheet since the 1950s,[4][5] and substantial losses of ice from its coastal glaciers since at least the 1990s.[6] It is believed to have added about 7.6 ± 3.9 mm (19⁄64 ± 5⁄32 in) to the global sea level rise between 1992 and 2017,[7] and has been losing ice in the 2010s at a rate equivalent to 0.4 millimetres (0.016 inches) of annual sea level rise.[8] It is certain that it will continue to lose ice in the future, but much less certainty over how fast that would occur. While it is most likely to lose about 11 cm (5 in) by 2100, marine ice sheet instability may increase this amount by tens of centimeters, particularly under high warming.[9]
In the long term, West Antarctic Ice Sheet is likely to disappear, potentially leaving only mountain ice caps behind.[10] Paleoclimate evidence suggests that this has already happened during the Eemian period, when the global temperatures were similar to the early 21st century.[11][12] It is believed that the loss of the ice sheet would take place between 2,000 and 13,000 years,[13][14] although several centuries of high emissions may shorten this to 500 years.[15] 3.3 m (10 ft 10 in) of sea level rise would occur if the ice sheet collapses but leaves ice caps on the mountains behind, and 4.3 m (14 ft 1 in) if those melt as well.[2] Isostatic rebound may also add around 1 m (3 ft 3 in) to the global sea levels over another 1,000 years.[15]
If WAIS is already committed to disappearance, then stopping it may require a persistent reduction of global temperatures to 1 °C (1.8 °F) below the preindustrial level, or to 2 °C (3.6 °F) below the temperature of 2020.[16] It has also been suggested that artificially buttressing Thwaites Glacier and Pine Island Glacier, whose disappearance is necessary for the collapse of the ice sheet, would be able to delay its loss by many centuries, but this proposal is very new and uncertain, and would require one of the largest civil engineering interventions in history.
Description

The total volume of the entire Antarctic ice sheet is estimated at 26.92 million km3 (6.46 million cu mi),[2] while the WAIS contains about 2.1 million km3 (530,000 cu mi) in ice that is above the sea level, and ~1 million km3 (240,000 cu mi) in ice that is below it.[3] The weight of the ice has caused the underlying rock to sink by between 0.5 and 1 kilometre (0.31 and 0.62 miles)[17] in a process known as isostatic depression.
Under the force of its own weight, the ice sheet deforms and flows. The interior ice flows slowly over rough bedrock. In some circumstances, ice can flow faster in ice streams, separated by slow-flowing ice ridges. The inter-stream ridges are frozen to the bed while the bed beneath the ice streams consists of water-saturated sediments. Many of these sediments were deposited before the ice sheet occupied the region, when much of West Antarctica was covered by the ocean. The rapid ice-stream flow is a non-linear process still not fully understood; streams can start and stop for unclear reasons.[citation needed]
When ice reaches the coast, it either calves or continues to flow outward onto the water. The result is a large, floating ice shelf affixed to the continent. These ice shelves restrain the flow of ice streams for as long as they are present.[18]
West Antarctic Rift System
The West Antarctic Rift System (WARS) is one of the major active continental rifts on Earth.[19] In 2017, geologists from Edinburgh University discovered 91 volcanoes located two kilometres below the icy surface, making it the largest volcanic region on Earth.[20] The WARS is believed to have a major influence on ice flows in West Antarctica. In western Marie Byrd Land active glaciers flow through fault-bounded valleys (grabens) of the WARS.[21] Sub-ice volcanism has been detected and proposed to influence ice flow.[22] Fast-moving ice streams in the Siple Coast adjacent to the east edge of the Ross Ice Shelf are influenced by the lubrication provided by water-saturated till within fault-bounded grabens within the rift,[23][24] which would act to accelerate ice-sheet disintegration at more intense levels of climate change.[25]
History

Like the other ice sheets, West Antarctic Ice Sheet had undergone significant changes in size during its history. Up until around 400,000 years ago, the state of WAIS was largely governed by the effects of solar variation on heat content of the Southern Ocean, and it waxed and waned in accordance with a 41,000-year-long cycle.[26] Around 80,000 years ago, its size was comparable to now, but then it grew substantially larger, until its extent reached the margins of Antarctica's continental shelves during the Last Glacial Maximum ~30,000 years ago.[27] It then shrunk to around its preindustrial state some 3,000 years ago.[28] It also at times shrunk to a point only minor and isolated ice caps remained, such as during the Marine isotope stage 31 ∼1.07 million years ago,[28] or the Eemian period ~130,000 years ago.[11][12]
Climate change
Observations

West Antarctica has experienced statistically significant warming in the recent decades, although there's some uncertainty about its magnitude. In 2015, the warming of the WAIS between 1976 and 2012 was calculated as a range between 0.08 °C (0.14 °F) per decade and 0.96 °C (1.73 °F) per decade.[30] In 2009, the warming of the region since 1957 was estimated as exceeding 0.1 °C (0.18 °F) per decade.[4] This warming of WAIS is strongest in the Antarctic Peninsula. 2012 research found that the West Antarctic ice sheet had warmed by 2.4 °C (4.3 °F) since 1958 - around 0.46 °C (0.83 °F) per decade, which was almost double the 2009 estimate.[31] In 2022, Central WAIS warming between 1959 and 2000 was estimated at 0.31 °C (0.56 °F) per decade, with this change conclusively attributed to increases in greenhouse gas concentrations.[5]
Further, there has been increased melting of the ice sheet, although it has been primarily occurring at the coasts and caused by continually increasing ocean heat content rather than the warming of air temperatures.[8] Between 1996 and 2006, Antarctic ice mass loss increased by 75%.[32] Between 2005 and 2010, WAIS melting was thought to have added 0.28 millimetres (0.011 inches) to global sea levels every year.[33] Around 2012, the total mass loss from the West Antarctic Ice Sheet was estimated at 118 ± 9 gigatonnes per year.[34] Subsequent satellite observations revealed that the West Antarctic ice loss increased from 53 ± 29 gigatonnes per year in 1992 to 159 ± 26 gigatonnes per year in 2017, resulting in 7.6 ± 3.9 mm (19⁄64 ± 5⁄32 in) of Antarctica sea level rise.[7] By 2023, ~150 gigatonnes per year became the average annual rate of mass loss since 2002, equivalent to 0.4 millimetres (0.016 inches) of annual sea level rise.[8]
This ice loss is not only concentrated on the coasts, but on the Amundsen Sea Embayment[33] and its three most vulnerable glaciers - Thwaites Glacier, Pine Island Glacier and Smith Glacier.[35][36] Around 2005, they were thought to lose 60% more mass than what they have gained, and to contribute about 0.24 millimetres (0.0094 inches) per year to global sea level rise.[37]

Of the three, Thwaites Glacier is the best-known, to the point of being nicknamed the "Doomsday Glacier" by some in the press,[40][41] although many scientists consider it alarmist and inaccurate.[42] The reason for concern about Thwaites is because it had been experiencing substantial mass loss since at least the early 1990s,[6] while its local seabed topography provides no obstacles to rapid retreat,[43] with its most vulnerable parts located 1.5 mi (2.4 km) below the sea level.[44] Further, it had been shown in 2021 that the Thwaites Ice Shelf, which currently restrains the eastern portion of the Thwaites Glacier, could start to collapse within five years.[38][45][46] The glacier would start to see major losses "within decades" after the ice shelf's failure, and its annual contribution to sea level rise would increase from the current 4% to 5%, although it would still take centuries to disappear entirely.[47]
Projected 21st century ice loss

As the West Antarctic Ice Sheet loses ice, it inevitably contributes to sea level rise. However, projecting the exact amount is complicated for multiple reasons. For instance, while the main reason for its melting is the warming of ocean water in contact with its coastal glaciers, changes in atmospheric patterns may also affect the flow of these ocean currents.[48][49] Further, meltwater flowing out to the sea from the surface of the ice sheet into the ocean is also warmer than the average ocean water, and may change local current circulation to potentially accelerate melting, but this remains difficult to model.[50][51] Another complicated process is hydrofracturing, where meltwater collecting atop the ice sheet may pool into fractures and force them open, further damaging its integrity.[52] Further, it is already well-known that the ice shelves - massive blocks of ice floating next to the coastal glaciers - are very important, as they help to buttress the glaciers and their loss accelerates glacier breakdown. Yet, there is also the so-called marine ice cliff instability hypothesis, which additionally suggests that when those glaciers have cliffs with heights greater than 100 m (330 ft), they would rapidly collapse under their own weight in the absence of ice shelves.[53][54] This particular process has never been observed and was even ruled out by some of the more detailed modelling.[55]

Finally, the WAIS has a complex and potentially vulnerable topography, as the grounding lines of its glaciers are several hundred metres or more below sea level and the bed only deepens upstream.[28] This means that as more of the ice melts from underneath, even more could be exposed at an even greater depth once the ice above is no longer heavy enough to displace these flows. This is known as marine ice sheet instability (MISI), and it has the potential to greatly accelerate ice losses, yet a lot about it remains uncertain, and this uncertainty can have a substantial impact on even the 21st century sea level rise.[56] The Intergovernmental Panel on Climate Change has wrestled with the limited information about MISI for a long time. While year 2001 IPCC Third Assessment Report mentioned the possibility of such disintegration and provided a vague long-term estimate for what it described as a hypothetical, year 2007 IPCC Fourth Assessment Report omitted any mention of it as uncertainty increased, receiving criticism from a range of scientists.[57] The 2013/2014 IPCC Fifth Assessment Report was again unable to describe the risk, but it stated with medium confidence that it could add up to several tens of centimeters to 21st century sea level rise but not more. The report also suggested that in the absence of instability, WAIS would most likely add 6 cm (0 in) under the low-emission scenario RCP2.6 and 4 cm (0 in) under RCP8.5, where the greenhouse gas emissions continue to increase at a high rate for the rest of the century. This was done under the assumption that the more intense effects of climate change on the water cycle result in an increased precipitation over the ice sheet, which would freeze on the surface, and this increase in the surface mass balance (SMB) would counteract a larger fraction of the ice loss[58]
Afterwards, several major research publications in the late 2010s (including the Fourth United States National Climate Assessment in 2017) suggested that if instability was triggered, then the overall sea level rise (combining melt of West Antarctica and also Greenland, mountain glaciers and thermal expansion of seawater) from the high-emission climate change scenario could double, potentially exceeding 2 m (5 ft) by 2100 in the worst case.[59][60][61][62] A 2016 study led by Jim Hansen presented a hypothesis of vulnerable ice sheet collapse leading to near-term exponential sea level rise acceleration, with a doubling time of 10, 20 or 40 years, which would then lead to multi-meter sea level rise in 50, 100 or 200 years.[63][64] However, it remains a minority view amongst the scientific community,[65] For comparison, year 2020 survey of 106 experts found that their 5%-95% confidence interval of 2100 sea level rise for the high-emission scenario RCP8.5 was 45–165 cm (17+1⁄2–65 in), the latter including ice sheet instability.[66]

Consequently, when the IPCC Sixth Assessment Report was published in 2021-2022, it estimated that while the median increase in sea level rise from the West Antarctic ice sheet melt by 2100 would be ~11 cm (5 in) under all emission scenarios (since the increased warming would intensify the water cycle and increase snowfall accumulation over the ice sheet at about the same rate as it would increase ice loss), it can conceivably contribute as much as 41 cm (16 in) by 2100 under the low-emission scenario and 57 cm (22 in) under the highest-emission one, due to the aforementioned uncertainties. It had also suggested that by the year 2300, Antarctica's role in sea level rise would only slightly increase from 2100 if the low-emission RCP2.6 scenario was followed, only contributing a median of 16 cm (5 in). On the other hand, even the minimum estimate of West Antarctica melting under the high-emission scenario would be no less than 60 cm (0 ft), while the median would amount to 1.46 m (5 ft) and the maximum to 2.89 m (10 ft).[9]
Long-term thinning and collapse
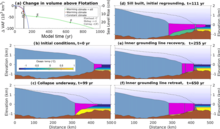
Because a significant fraction of the ice sheet is located deep beneath the sea level,[28] it is particularly vulnerable to large-scale collapse in response to accelerated warming from greenhouse gas emissions. This hypothesis had first been presented in a 1968 paper by glaciologist J.H. Mercer,[68][44] and were reiterated in 1973 and 1978, as radar measurements from research flights revealed that the glacier beds in Pine Island Bay slope downwards at an angle, well below the sea level and so even a relatively limited warming of ocean currents ice would effectively undermine the ice.[69][44][29] In 1981, the Amundsen Sea region had first been described by the researchers as "the weak underbelly" of the WAIS, with the theory that the collapse of Thwaites Glacier and Pine Island Glacier would trigger for the collapse of the entire ice sheet,[70][44] which had been supported by subsequent research.[71]
Nowadays, the potential for the West Antarctic Ice Sheet to disappear after a certain temperature is exceeded is considered one of the tipping points in the climate system. At best, it may withstand up to 3 °C (5.4 °F) before it would melt irreversibly.[13][9] However, the WAIS is considered much more likely to be committed to disappearance around 1.5 °C (2.7 °F), or perhaps even 1 °C (1.8 °F), which has already been reached in the early 21st century.[13][14]
Findings demonstrating that the present warming is sufficient or near-sufficient to cause the disappearance of the WAIS include paleoclimate evidence from the Eemian period, such as analysis of silt isotopes in the Bellingshausen Sea, or the genomic history of Antarctica's Turquet's octopus. The former shows specific patterns in silt deposition and the latter genetic connections between currently separate subpopulations; both are impossible unless there was no ice outside of mountain caps in the West Antarctica around 125,000 years ago, during Marine Isotope Stage 5. Since that period was only 0.5 °C (0.90 °F) to 1.5 °C (2.7 °F) warmer than the preindustrial period, the current levels of warming are also likely to be sufficient to eventually melt the ice sheet.[72][73][11][12][74] Further, 2023 oceanographic research indicates that over the 21st century, water temperatures in the entire Amundsen Sea would increase at triple the historical rate even with low or "medium" atmospheric warming and even faster with high warming: such rate of temperature increase would make the collapse of the ice sheet inevitable.[10][75]

However, while the West Antarctic Ice Sheet is likely to be committed to disappearance, that disappearance would still take a long time. Even its most vulnerable parts like Thwaites Glacier, which holds about 65 cm (25+1⁄2 in) of sea level rise equivalent, are believed to require "centuries" to collapse entirely.[47] Thwaites' ice loss over the next 30 years would likely amount to around 5 mm of sea level rise between 2018 and 2050, and between 14 and 42 mm over 100 years.[76] An earlier paper, which concluded that Thwaites would be inevitably lost under all but the lowest possible levels of future warming (and subsequent findings foreclosed that possibility as well[77] ), had also noted that it was expected to add less than 0.25 mm of global sea level rise per year over the 21st century, increasing to over 1 mm per year during its "rapid collapse" phase, which it expected to occur between 200 and 900 years in the future.[78][79][80] 2023 research had also shown that much of the glacier may survive 500 years into the future.[81]
Consequently, the entire WAIS would most likely take 2,000 years to disintegrate entirely once it crosses its tipping point. Under the highest warming scenario RCP8.5, this may shortened to around 500 years,[15] while the longest potential timescale for its disappearance is around 13,000 years.[13][14] In 1978, it was believed that the loss of the ice sheet would cause around 5 m (16 ft 5 in) of sea level rise,[69] Later improvements in modelling had shown that the collapse of the ice grounded below the sea level would cause ~3.3 m (10 ft 10 in) of sea level rise,[82] while the additional melting of all the ice caps in West Antarctica that are not in contact with water would increase it to 4.3 m (14 ft 1 in).[2] However, 2021 research indicates that isostatic rebound after the loss of the main portion of the ice sheet would ultimately add another 1.02 m (3 ft 4 in) to global sea levels. While this effect would start to increase sea levels before 2100, it would take 1000 years for it to cause 83 cm (2 ft 9 in) of sea level rise - at which point, West Antarctica itself would be 610 m (2,001 ft 4 in) higher than now.[15] Because the ice sheet is so reflective, its loss would also have some effect on the ice-albedo feedback: a total loss would increase the global temperatures by 0.05 °C (0.090 °F), while the local temperatures would increase by around 1 °C (1.8 °F).[13][14]
Reversing or slowing ice sheet loss
While it would take a very long time from start to end for the ice sheet to disappear, some research indicates that the only way to stop its complete meltdown once triggered is by lowering the global temperature to 1 °C (1.8 °F) below the preindustrial level; i.e. 2 °C (3.6 °F) below the temperature of 2020.[16] Other researchers have proposed engineering interventions to stabilize Thwaites and Pine Island Glaciers before they are lost.
Some engineering interventions have been proposed for Thwaites Glacier and the nearby Pine Island Glacier to stabilize its ice physically, or to preserve it by blocking the flow of warm ocean water, which currently renders the collapse of these two glaciers practically inevitable even without further warming.[84][85] A proposal from 2018 included building sills at the Thwaites' grounding line to either physically reinforce it, or to block some fraction of warm water flow. The former would be the simplest intervention, yet still equivalent to "the largest civil engineering projects that humanity has ever attempted": it is also only 30% likely to work. Constructions blocking even 50% of the warm water flow are expected to be far more effective, yet far more difficult as well.[83] Further, some researchers dissented, arguing that this proposal could be ineffective, or even accelerate sea level rise.[86] The original authors have suggested attempting this intervention on smaller sites, like the Jakobshavn Glacier in Greenland, as a test run,[83][85] as well as acknowledging that this intervention cannot prevent sea level rise from the increased ocean heat content, and would be ineffective in the long run without greenhouse gas emission reductions.[83]
In 2023, a modified proposal was tabled: it was proposed that an installation of underwater "curtains", made out of a flexible material and anchored to Amundsen Sea floor would be able to interrupt warm water flow while reducing costs and increasing their longevity (conservatively estimated at 25 years for curtain elements and up to 100 years for the foundations) relative to more rigid structures. With them in place, Thwaites Ice Shelf and Pine Island Ice Shelf would presumably be able to regrow to a state they last had a century ago, thus stabilizing these glaciers.[87][88][85] To achieve this, the curtains would have to be placed at a depth of around 600 metres (0.37 miles) (to avoid damage from icebergs which would be regularly drifting above) and be 80 km (50 mi) long. The authors acknowledged that while work on this scale would be unprecedented and face many challenges in the Antarctic (including polar night and the currently insufficient numbers of specialized polar ships and underwater vessels), it would also not require any new technology and there is already experience of laying down pipelines at such depths.[87][88]

See also
- East Antarctic Ice Sheet
- List of glaciers in the Antarctic
- Retreat of glaciers since 1850
- WAIS Divide Ice Core Drilling Project
References
- ^ a b c Davies, Bethan (21 October 2020). "West Antarctic Ice Sheet". AntarcticGlaciers.org.
- ^ a b c d Fretwell, P.; et al. (28 February 2013). "Bedmap2: improved ice bed, surface and thickness datasets for Antarctica" (PDF). The Cryosphere. 7 (1): 390. Bibcode:2013TCry....7..375F. doi:10.5194/tc-7-375-2013. S2CID 13129041. Archived (PDF) from the original on 16 February 2020. Retrieved 6 January 2014.
- ^ a b Lythe, Matthew B.; Vaughan, David G. (June 2001). "BEDMAP: A new ice thickness and subglacial topographic model of Antarctica" (PDF). Journal of Geophysical Research. 106 (B6): 11335–11352. Bibcode:2001JGR...10611335L. doi:10.1029/2000JB900449.
- ^ a b Steig, E. J.; Schneider, D. P.; Rutherford, S. D.; Mann, M. E.; Comiso, J. C.; Shindell, D. T. (2009). "Warming of the Antarctic ice-sheet surface since the 1957 International Geophysical Year". Nature. 457 (7228): 459–462. Bibcode:2009Natur.457..459S. doi:10.1038/nature07669. PMID 19158794. S2CID 4410477.
- ^ a b Dalaiden, Quentin; Schurer, Andrew P.; Kirchmeier-Young, Megan C.; Goosse, Hugues; Hegerl, Gabriele C. (24 August 2022). "West Antarctic Surface Climate Changes Since the Mid-20th Century Driven by Anthropogenic Forcing". Geophysical Research Letters. 49 (16). doi:10.1029/2022GL099543. hdl:20.500.11820/64ecd5a1-af19-43e8-9d34-da7274cc4ae0.
- ^ a b Rignot, Eric (2001). "Evidence for rapid retreat and mass loss of Thwaites Glacier, West Antarctica". Journal of Glaciology. 47 (157): 213–222. Bibcode:2001JGlac..47..213R. doi:10.3189/172756501781832340. S2CID 128683798.
- ^ a b The IMBIE Team (13 June 2018). "Mass balance of the Antarctic Ice Sheet from 1992 to 2017". Nature Geoscience. 558: 219–222. doi:10.1038/s41586-018-0179-y.
- ^ a b c NASA (7 July 2023). "Antarctic Ice Mass Loss 2002-2023".
- ^ a b c Fox-Kemper, B.; Hewitt, H.T.; Xiao, C.; Aðalgeirsdóttir, G.; Drijfhout, S.S.; Edwards, T.L.; Golledge, N.R.; Hemer, M.; Kopp, R.E.; Krinner, G.; Mix, A. (2021). Masson-Delmotte, V.; Zhai, P.; Pirani, A.; Connors, S.L.; Péan, C.; Berger, S.; Caud, N.; Chen, Y.; Goldfarb, L. (eds.). "Chapter 9: Ocean, Cryosphere and Sea Level Change" (PDF). Climate Change 2021: The Physical Science Basis. Contribution of Working Group I to the Sixth Assessment Report of the Intergovernmental Panel on Climate Change. Cambridge University Press, Cambridge, UK and New York, NY, USA: 1270–1272.
- ^ a b A. Naughten, Kaitlin; R. Holland, Paul; De Rydt, Jan (23 October 2023). "Unavoidable future increase in West Antarctic ice-shelf melting over the twenty-first century". Nature Climate Change. 13 (11): 1222–1228. doi:10.1038/s41558-023-01818-x. S2CID 264476246. Retrieved 26 October 2023.
- ^ a b c Carlson, Anders E; Walczak, Maureen H; Beard, Brian L; Laffin, Matthew K; Stoner, Joseph S; Hatfield, Robert G (10 December 2018). Absence of the West Antarctic ice sheet during the last interglaciation. American Geophysical Union Fall Meeting.
- ^ a b c Lau, Sally C. Y.; Wilson, Nerida G.; Golledge, Nicholas R.; Naish, Tim R.; Watts, Phillip C.; Silva, Catarina N. S.; Cooke, Ira R.; Allcock, A. Louise; Mark, Felix C.; Linse, Katrin (21 December 2023). "Genomic evidence for West Antarctic Ice Sheet collapse during the Last Interglacial". Science. 382 (6677): 1384–1389. doi:10.1126/science.ade0664.
- ^ a b c d e Armstrong McKay, David; Abrams, Jesse; Winkelmann, Ricarda; Sakschewski, Boris; Loriani, Sina; Fetzer, Ingo; Cornell, Sarah; Rockström, Johan; Staal, Arie; Lenton, Timothy (9 September 2022). "Exceeding 1.5°C global warming could trigger multiple climate tipping points". Science. 377 (6611): eabn7950. doi:10.1126/science.abn7950. hdl:10871/131584. ISSN 0036-8075. PMID 36074831. S2CID 252161375.
- ^ a b c d Armstrong McKay, David (9 September 2022). "Exceeding 1.5°C global warming could trigger multiple climate tipping points – paper explainer". climatetippingpoints.info. Retrieved 2 October 2022.
- ^ a b c d Pan, Linda; Powell, Evelyn M.; Latychev, Konstantin; Mitrovica, Jerry X.; Creveling, Jessica R.; Gomez, Natalya; Hoggard, Mark J.; Clark, Peter U. (30 April 2021). "Rapid postglacial rebound amplifies global sea level rise following West Antarctic Ice Sheet collapse". Science Advances. 7 (18). doi:10.1126/sciadv.abf7787.
- ^ a b Garbe, Julius; Albrecht, Torsten; Levermann, Anders; Donges, Jonathan F.; Winkelmann, Ricarda (2020). "The hysteresis of the Antarctic Ice Sheet". Nature. 585 (7826): 538–544. Bibcode:2020Natur.585..538G. doi:10.1038/s41586-020-2727-5. PMID 32968257. S2CID 221885420.
- ^ Anderson, John B. (1999). Antarctic marine geology. Cambridge University Press. p. 59. ISBN 978-0-521-59317-5.
- ^ Ice Shelves, Antarctic and Southern Ocean Coalition Archived February 3, 2006, at the Wayback Machine
- ^ The Antarctic Rift: Plume vs. Plate Dynamics MantlePlumes.org
- ^ "Scientists discover 91 volcanoes below Antarctic ice sheet". The Guardian. 12 August 2017. Retrieved 13 August 2017.
- ^ Luyendyk, Bruce P.; Wilson, Douglas S.; Siddoway, Christine S. (2003-10-01). "Eastern margin of the Ross Sea Rift in western Marie Byrd Land, Antarctica: Crustal structure and tectonic development". Geochemistry, Geophysics, Geosystems. 4 (10): 1090. Bibcode:2003GGG.....4.1090L. doi:10.1029/2002GC000462. ISSN 1525-2027.
- ^ Blankenship, Donald D.; Bell, Robin E.; Hodge, Steven M.; Brozena, John M.; Behrendt, John C.; Finn, Carol A. (1993). "Active volcanism beneath the West Antarctic ice sheet and implications for ice-sheet stability". Nature. 361 (6412): 526–529. Bibcode:1993Natur.361..526B. doi:10.1038/361526a0. ISSN 1476-4687. S2CID 4267792.
- ^ Studinger, Michael; Bell, Robin E.; Blankenship, Donald D.; Finn, Carol A.; Arko, Robert A.; Morse, David L.; Joughin, Ian (2001-09-15). "Subglacial sediments: A regional geological template for ice flow in West Antarctica". Geophysical Research Letters. 28 (18): 3493–3496. Bibcode:2001GeoRL..28.3493S. doi:10.1029/2000GL011788. ISSN 1944-8007.
- ^ Peters, Leo E.; Anandakrishnan, Sridhar; Alley, Richard B.; Winberry, J. Paul; Voigt, Donald E.; Smith, Andrew M.; Morse, David L. (2006-01-01). "Subglacial sediments as a control on the onset and location of two Siple Coast ice streams, West Antarctica". Journal of Geophysical Research: Solid Earth. 111 (B1). Bibcode:2006JGRB..111.1302P. doi:10.1029/2005JB003766. ISSN 2156-2202.
- ^ Veen, C. J. Van Der; Whillans, I. M. (1993). "New and improved determinations of velocity of Ice Streams B and C, West Antarctica". Journal of Glaciology. 39 (133): 483–590. doi:10.3189/S0022143000016373. hdl:1808/17424. ISSN 1727-5652.
- ^ Ohneiser, Christian; Hulbe, Christina L.; Beltran, Catherine; Riesselman, Christina R.; Moy, Christopher M.; Condon, Donna B.; Worthington, Rachel A. (5 December 2022). "West Antarctic ice volume variability paced by obliquity until 400,000 years ago". Nature Geoscience. 16: 44–49. doi:10.1038/s41561-022-01088-w.
- ^ Gowan, Evan J.; Zhang, Xu; Khosravi, Sara; Rovere, Alessio; Stocchi, Paolo; Hughes, Anna L. C.; Gyllencreutz, Richard; Mangerud, Jan; Svendsen, John-Inge; Lohmann, Gerrit (23 February 2021). "A new global ice sheet reconstruction for the past 80 000 years". Nature Communications. 12. doi:10.1038/s41467-021-21469-w. hdl:10278/3747429.
- ^ a b c d Pollard, David; DeConto, Robert M. (19 March 2009). "Modelling West Antarctic ice sheet growth and collapse through the past five million years". Nature. 458: 329–332. doi:10.1038/nature07809.
- ^ a b Dotto, Tiago S.; Heywood, Karen J.; Hall, Rob A.; et al. (21 December 2022). "Ocean variability beneath Thwaites Eastern Ice Shelf driven by the Pine Island Bay Gyre strength". Nature Communications. 13 (1): 7840. Bibcode:2022NatCo..13.7840D. doi:10.1038/s41467-022-35499-5. PMC 9772408. PMID 36543787.
- ^ Ludescher, Josef; Bunde, Armin; Franzke, Christian L. E.; Schellnhuber, Hans Joachim (16 April 2015). "Long-term persistence enhances uncertainty about anthropogenic warming of Antarctica". Climate Dynamics. 46 (1–2): 263–271. Bibcode:2016ClDy...46..263L. doi:10.1007/s00382-015-2582-5. S2CID 131723421.
- ^ McGrath, Matt (23 December 2012). "West Antarctic Ice Sheet warming twice earlier estimate". BBC News. Retrieved 16 February 2013.
- ^ Rignot, Eric; Bamber, Jonathan L.; van den Broeke, Michiel R.; Davis, Curt; Li, Yonghong; van de Berg, Willem Jan; van Meijgaard, Erik (13 January 2008). "Recent Antarctic ice mass loss from radar interferometry and regional climate modelling". Nature Geoscience. 1 (2): 106–110. Bibcode:2008NatGe...1..106R. doi:10.1038/ngeo102. S2CID 784105.
- ^ a b ESA (11 December 2013). "Antarctica's ice loss on the rise".
- ^ King, M. A.; Bingham, R. J.; Moore, P.; Whitehouse, P. L.; Bentley, M. J.; Milne, G. A. (2012). "Lower satellite-gravimetry estimates of Antarctic sea-level contribution". Nature. 491 (7425): 586–589. Bibcode:2012Natur.491..586K. doi:10.1038/nature11621. PMID 23086145. S2CID 4414976.
- ^ Rignot, E. (2008). "Changes in West Antarctic ice stream dynamics observed with ALOS PALSAR data". Geophysical Research Letters. 35 (12): L12505. Bibcode:2008GeoRL..3512505R. doi:10.1029/2008GL033365.
- ^ Rignot, E., J. Mouginot, M. Morlighem, H. Seroussi and B. Scheuch (May 12, 2014). "Widespread, rapid grounding line retreat of Pine Island, Thwaites, Smith and Kohler glaciers, West Antarctica from 1992 to 2011". Geophysical Research Letters. 41 (10): 3502–3509. Bibcode:2014GeoRL..41.3502R. doi:10.1002/2014GL060140. S2CID 55646040.
{cite journal}: CS1 maint: multiple names: authors list (link) - ^ Jenny Hogan, "Antarctic ice sheet is an 'awakened giant'", New Scientist, February 2, 2005
- ^ a b Wild, Christian T.; Alley, Karen E.; Muto, Atsuhiro; Truffer, Martin; Scambos, Ted A.; Pettit, Erin C. Pettit (3 February 2022). "Weakening of the pinning point buttressing Thwaites Glacier, West Antarctica". The Cryosphere. 16 (2): 397–417. Bibcode:2022TCry...16..397W. doi:10.5194/tc-16-397-2022.
- ^ Gudmundsson, G. H.; Barnes, J. M. A.; Goldberg, D. N.; Morlighem, M. (31 May 2023). "Limited Impact of Thwaites Ice Shelf on Future Ice Loss From Antarctica". Geophysical Research Letters. 50 (11). Bibcode:2023GeoRL..5002880G. doi:10.1029/2023GL102880. S2CID 259008792.
- ^ Goodell, Jeff (9 May 2017). "The Doomsday Glacier". Rolling Stone. Retrieved 8 July 2023.
- ^ Rowlatt, Justin (28 January 2020). "Antarctica melting: Climate change and the journey to the 'doomsday glacier'". BBC News.
- ^ Ryan, Jackson (6 September 2022). "Please Stop Calling It the 'Doomsday Glacier'". CNET.
- ^ Rignot, Eric; Thomas, Robert H.; Kanagaratnam, Pannir; Casassa, Gino; Frederick, Earl; Gogineni, Sivaprasad; Krabill, William; Rivera, Andrès; Russell, Robert; Sontag, John (2004). "Improved estimation of the mass balance of glaciers draining into the Amundsen Sea sector of West Antarctica from the CECS/NASA 2002 campaign". Annals of Glaciology. 39: 231–237. doi:10.3189/172756404781813916. S2CID 129780210.
- ^ a b c d "The "Unstable" West Antarctic Ice Sheet: A Primer". NASA. 12 May 2014. Retrieved 8 July 2023.
- ^ Weeman, Katie; Scambos, Ted (13 December 2021). "The Threat from Thwaites: The Retreat of Antarctica's Riskiest Glacier". cires.colorado.edu (Press release). Cooperative Institute for Research in Environmental Sciences, University of Colorado Boulder. Retrieved 14 December 2021.
- ^ Kaplan, Sarah (December 13, 2021). "Crucial Antarctic ice shelf could fail within five years, scientists say". The Washington Post. Washington DC. Retrieved 14 December 2021.
- ^ a b Voosen, Paul (13 December 2021). "Ice shelf holding back keystone Antarctic glacier within years of failure". Science Magazine. Retrieved 22 October 2022.
Because Thwaites sits below sea level on ground that dips away from the coast, the warm water is likely to melt its way inland, beneath the glacier itself, freeing its underbelly from bedrock. A collapse of the entire glacier, which some researchers think is only centuries away, would raise global sea level by 65 centimeters.
- ^ "Statement: Thinning of West Antarctic Ice Sheet Demands Improved Monitoring to Reduce Uncertainty over Potential Sea-Level Rise". Jsg.utexas.edu. Retrieved 26 October 2017.
- ^ Thoma, M.; Jenkins, A.; Holland, D.; Jacobs, S. (2008). "Modelling Circumpolar Deep Water intrusions on the Amundsen Sea continental shelf, Antarctica" (PDF). Geophysical Research Letters. 35 (18): L18602. Bibcode:2008GeoRL..3518602T. doi:10.1029/2008GL034939. S2CID 55937812.
- ^ Golledge, Nicholas R.; Keller, Elizabeth D.; Gomez, Natalya; Naughten, Kaitlin A.; Bernales, Jorge; Trusel, Luke D.; Edwards, Tamsin L. (2019). "Global environmental consequences of twenty-first-century ice-sheet melt". Nature. 566 (7742): 65–72. Bibcode:2019Natur.566...65G. doi:10.1038/s41586-019-0889-9. ISSN 1476-4687. PMID 30728520. S2CID 59606358.
- ^ Moorman, Ruth; Morrison, Adele K.; Hogg, Andrew McC (2020-08-01). "Thermal Responses to Antarctic Ice Shelf Melt in an Eddy-Rich Global Ocean–Sea Ice Model". Journal of Climate. 33 (15): 6599–6620. Bibcode:2020JCli...33.6599M. doi:10.1175/JCLI-D-19-0846.1. ISSN 0894-8755. S2CID 219487981.
- ^ a b Pattyn, Frank (16 July 2018). "The paradigm shift in Antarctic ice sheet modelling". Nature Communications. 9 (1): 2728. Bibcode:2018NatCo...9.2728P. doi:10.1038/s41467-018-05003-z. PMC 6048022. PMID 30013142.
- ^ DeConto, Robert M.; Pollard, David (30 March 2016). "Contribution of Antarctica to past and future sea-level rise". Nature. 531: 591–597. doi:10.1038/nature17145.
- ^ Gillis, Justin (30 March 2016). "Climate Model Predicts West Antarctic Ice Sheet Could Melt Rapidly". The New York Times.
- ^ Perkins, Sid (June 17, 2021). "Collapse may not always be inevitable for marine ice cliffs". ScienceNews. Retrieved 9 January 2023.
- ^ Robel, Alexander A.; Seroussi, Hélène; Roe, Gerard H. (23 July 2019). "Marine ice sheet instability amplifies and skews uncertainty in projections of future sea-level rise". Proceedings of the National Academy of Sciences. 116 (30): 14887–14892. Bibcode:2019PNAS..11614887R. doi:10.1073/pnas.1904822116. PMC 6660720. PMID 31285345.
- ^ O'Reilly, Jessica; Oreskes, Naomi; Oppenheimer, Michael (26 June 2012). "The Rapid Disintegration of Projections: The West Antarctic Ice Sheet and the Intergovernmental Panel on Climate Change". Social Studies of Science. 42 (5). doi:10.1177/0306312712448130.
- ^ Church, J. A.; Clark, P. U. (2013). "Sea Level Change". In Stocker, T. F.; et al. (eds.). Climate Change 2013: The Physical Science Basis. Contribution of Working Group I to the Fifth Assessment Report of the Intergovernmental Panel on Climate Change. Cambridge, United Kingdom and New York, New York, US: Cambridge University Press.
- ^ USGCRP (2017). "Climate Science Special Report. Chapter 12: Sea Level Rise". science2017.globalchange.gov: 1–470. Retrieved 2018-12-27.
- ^ Chris Mooney (October 26, 2017). "New science suggests the ocean could rise more – and faster – than we thought". The Chicago Tribune. Chicago, Illinois.
- ^ Nauels, Alexander; Rogelj, Joeri; Schleussner, Carl-Friedrich; Meinshausen, Malte; Mengel, Matthias (1 November 2017). "Linking sea level rise and socioeconomic indicators under the Shared Socioeconomic Pathways". Environmental Research Letters. 12 (11): 114002. Bibcode:2017ERL....12k4002N. doi:10.1088/1748-9326/aa92b6. hdl:20.500.11850/230713.
- ^ L. Bamber, Jonathan; Oppenheimer, Michael; E. Kopp, Robert; P. Aspinall, Willy; M. Cooke, Roger (May 2019). "Ice sheet contributions to future sea-level rise from structured expert judgment". Proceedings of the National Academy of Sciences. 116 (23): 11195–11200. Bibcode:2019PNAS..11611195B. doi:10.1073/pnas.1817205116. PMC 6561295. PMID 31110015.
- ^ Hansen, James; Sato, Makiko; Hearty, Paul; Ruedy, Reto; Kelley, Maxwell; Masson-Delmotte, Valerie; Russell, Gary; Tselioudis, George; Cao, Junji; Rignot, Eric; Velicogna, Isabella; Tormey, Blair; Donovan, Bailey; Kandiano, Evgeniya; von Schuckmann, Karina; Kharecha, Pushker; Legrande, Allegra N.; Bauer, Michael; Lo, Kwok-Wai (22 March 2016). "Ice melt, sea level rise and superstorms: evidence from paleoclimate data, climate modeling, and modern observations that 2 °C global warming could be dangerous". Atmospheric Chemistry and Physics. 16 (6): 3761–3812. arXiv:1602.01393. Bibcode:2016ACP....16.3761H. doi:10.5194/acp-16-3761-2016. S2CID 9410444.
- ^ Gillis, Justin (22 March 2016). "Scientists Warn of Perilous Climate Shift Within Decades, Not Centuries". The New York Times.
- ^ "James Hansen's controversial sea level rise paper has now been published online". The Washington Post. 2015.
There is no doubt that the sea level rise, within the IPCC, is a very conservative number," says Greg Holland, a climate and hurricane researcher at the National Center for Atmospheric Research, who has also reviewed the Hansen study. "So the truth lies somewhere between IPCC and Jim.
- ^ Horton, Benjamin P.; Khan, Nicole S.; Cahill, Niamh; Lee, Janice S. H.; Shaw, Timothy A.; Garner, Andra J.; Kemp, Andrew C.; Engelhart, Simon E.; Rahmstorf, Stefan (2020-05-08). "Estimating global mean sea-level rise and its uncertainties by 2100 and 2300 from an expert survey". npj Climate and Atmospheric Science. 3 (1): 18. Bibcode:2020npjCA...3...18H. doi:10.1038/s41612-020-0121-5. hdl:10356/143900. S2CID 218541055.
- ^ a b "Anticipating Future Sea Levels". EarthObservatory.NASA.gov. National Aeronautics and Space Administration (NASA). 2021. Archived from the original on 7 July 2021.
- ^ Mercer, J. H. "ANTARCTIC ICE AND SANGAMON SEA LEVEL" (PDF). International Association Of Hydrological Sciences. Retrieved 8 July 2023.
- ^ a b Mercer, J. H. (1 January 1978). "West Antarctic ice sheet and CO2 greenhouse effect: a threat of disaster". Nature. 271 (5643): 321–325. Bibcode:1978Natur.271..321M. doi:10.1038/271321a0. S2CID 4149290.
- ^ Hughes, T. J. (1981). "The weak underbelly of the West Antarctic ice sheet". Journal of Glaciology. 27 (97): 518–525. doi:10.3189/S002214300001159X.
- ^ Feldmann, J; Levermann, A (17 November 2015). "Collapse of the West Antarctic Ice Sheet after local destabilization of the Amundsen Basin". Proceedings of the National Academy of Sciences. 112 (46): 14191–14196. Bibcode:2015PNAS..11214191F. doi:10.1073/pnas.1512482112. PMC 4655561. PMID 26578762.
- ^ Voosen, Paul (2018-12-18). "Discovery of recent Antarctic ice sheet collapse raises fears of a new global flood". Science. Retrieved 2018-12-28.
- ^ Turney, Chris S. M.; Fogwill, Christopher J.; Golledge, Nicholas R.; McKay, Nicholas P.; Sebille, Erik van; Jones, Richard T.; Etheridge, David; Rubino, Mauro; Thornton, David P.; Davies, Siwan M.; Ramsey, Christopher Bronk (2020-02-11). "Early Last Interglacial ocean warming drove substantial ice mass loss from Antarctica". Proceedings of the National Academy of Sciences. 117 (8): 3996–4006. Bibcode:2020PNAS..117.3996T. doi:10.1073/pnas.1902469117. ISSN 0027-8424. PMC 7049167. PMID 32047039.
- ^ AHMED, Issam. "Antarctic octopus DNA reveals ice sheet collapse closer than thought". phys.org. Retrieved 2023-12-23.
- ^ Poynting, Mark (24 October 2023). "Sea-level rise: West Antarctic ice shelf melt 'unavoidable'". BBC. Retrieved 26 October 2023.
- ^ Yu, Hongju; Rignot, Eric; Seroussi, Helene; Morlighem, Mathieu (11 December 2018). "Retreat of Thwaites Glacier, West Antarctica, over the next 100 years using various ice flow models, ice shelf melt scenarios and basal friction laws". The Cryosphere. 12 (12): 3861–3876. doi:10.5194/tc-12-3861-2018.
- ^ Holland, Paul R.; Bevan, Suzanne L.; Luckman, Adrian J. (11 April 2023). "Strong Ocean Melting Feedback During the Recent Retreat of Thwaites Glacier". Geophysical Research Letters. 50 (8). Bibcode:2023GeoRL..5003088H. doi:10.1029/2023GL103088.
- ^ Joughin, I. (16 May 2014). "Marine Ice Sheet Collapse Potentially Under Way for the Thwaites Glacier Basin, West Antarctica". Science. 344 (6185): 735–738. Bibcode:2014Sci...344..735J. doi:10.1126/science.1249055. PMID 24821948. S2CID 206554077.
- ^ "Irreversible collapse of Antarctic glaciers has begun, studies say". Los Angeles Times. 12 May 2014. Retrieved 13 May 2014.
- ^ "Scientists warn of rising sea levels as huge Antarctic ice sheet slowly melts". Ctvnews.ca. 12 May 2014. Retrieved 26 October 2017.
- ^ Schwans, Emily; Parizek, Byron R.; Alley, Richard B.; Anandakrishnan, Sridhar; Morlighem, Mathieu M. (9 May 2023). "Model insights into bed control on retreat of Thwaites Glacier, West Antarctica". Journal of Glaciology. 69 (277): 1241–1259. doi:10.1017/jog.2023.13. S2CID 258600944.
- ^ Bamber, J.L.; Riva, R.E.M.; Vermeersen, B.L.A.; LeBrocq, A.M. (14 May 2009). "Reassessment of the Potential Sea-Level Rise from a Collapse of the West Antarctic Ice Sheet". Science. 324 (5929): 901–903. Bibcode:2009Sci...324..901B. doi:10.1126/science.1169335. PMID 19443778. S2CID 11083712.
- ^ a b c d Wolovick, Michael J.; Moore, John C. (20 September 2018). "Stopping the flood: could we use targeted geoengineering to mitigate sea level rise?". The Cryosphere. 12 (9): 2955–2967. Bibcode:2018TCry...12.2955W. doi:10.5194/tc-12-2955-2018. S2CID 52969664.
- ^ Joughin, I. (16 May 2014). "Marine Ice Sheet Collapse Potentially Under Way for the Thwaites Glacier Basin, West Antarctica". Science. 344 (6185): 735–738. Bibcode:2014Sci...344..735J. doi:10.1126/science.1249055. PMID 24821948. S2CID 206554077.
- ^ a b c d James Temple (14 January 2022). "The radical intervention that might save the "doomsday" glacier". MIT Technology Review. Retrieved 19 July 2023.
- ^ Moon, Twila A. (25 April 2018). "Geoengineering might speed glacier melt". Nature. 556 (7702): 436. Bibcode:2018Natur.556R.436M. doi:10.1038/d41586-018-04897-5. PMID 29695853.
- ^ a b c d e f Wolovick, Michael; Moore, John; Keefer, Bowie (27 March 2023). "Feasibility of ice sheet conservation using seabed anchored curtains". PNAS Nexus. 2 (3): pgad053. doi:10.1093/pnasnexus/pgad053. PMC 10062297. PMID 37007716.
- ^ a b c d e Wolovick, Michael; Moore, John; Keefer, Bowie (27 March 2023). "The potential for stabilizing Amundsen Sea glaciers via underwater curtains". PNAS Nexus. 2 (4): pgad103. doi:10.1093/pnasnexus/pgad103. PMC 10118300. PMID 37091546.
External links
- WAIS – West Antarctic Ice Sheet Initiative – A multidisciplinary study of rapid climate change and future sea level. Sponsored by National Science Foundation Office of Polar Programs and NASA Earth Science.
- U.S. National Snow and Ice Data Center Antarctic Data