2022 United States House of Representatives elections
| ||||||||||||||||||||||||||||||||||
All 435 seats in the United States House of Representatives[a] 218 seats needed for a majority | ||||||||||||||||||||||||||||||||||
|---|---|---|---|---|---|---|---|---|---|---|---|---|---|---|---|---|---|---|---|---|---|---|---|---|---|---|---|---|---|---|---|---|---|---|
| ||||||||||||||||||||||||||||||||||
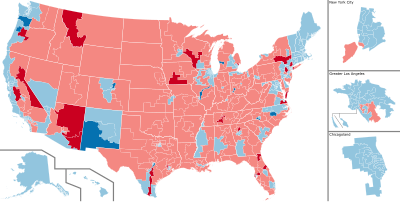
 Results Democratic gain Republican gain Democratic hold Republican hold | ||||||||||||||||||||||||||||||||||
| ||||||||||||||||||||||||||||||||||
The 2022 United States House of Representatives elections were held on November 8 2022 to elect the United States House of Representatives. It was part of the 2022 United States elections.
The Republican Party gained control of the House from the Democratic Party. Republican Kevin McCarthy replaced Democratic Nancy Pelosi as Speaker.
Results
Federal
| 222 | 213 |
| Republican | Democratic |
| Parties | Popular vote | Seats | |||||||
|---|---|---|---|---|---|---|---|---|---|
| Vote | % | Change | 2020 | 2022 | +/− | Strength | +/− | ||
| Republican Party | 54,227,992 | 50.0% | +2.8% | 213 | 222 | 51.0% | +2.0% | ||
| Democratic Party | 51,280,463 | 47.3% | –3.0% | 222 | 213 | 49.0% | –2.0% | ||
| Libertarian Party | 724,264 | 0.7% | – | — | — | — | — | — | |
| Independent | 515,322 | 0.5% | +0.2% | — | — | — | — | — | |
| Green Party | 69,802 | 0.1% | — | — | — | — | — | — | |
| Constitution Party | 29,886 | 0.0% | –0.1% | — | — | — | — | — | |
| Other parties | 1,481,822 | 1.4% | +0.1% | — | — | — | — | — | |
| Write-ins | 113,836 | 0.1% | – | — | — | — | — | — | |
| Totals | 108,443,387 | 100.0% | — | 435 | 435 | 100.0% | — | ||
| Source: [1] Election Statistics – Office of the Clerk | |||||||||
By state
| State | Total seats |
Republican | Democratic | ||
|---|---|---|---|---|---|
| Seats | Change | Seats | Change | ||
| Alabama | 7 | 6 | 1 | ||
| Alaska | 1 | 0 | 1 | ||
| Arizona | 9 | 6 | 3 | ||
| Arkansas | 4 | 4 | 0 | ||
| California | 52 | 12 | 40 | ||
| Colorado | 8 | 3 | 5 | ||
| Connecticut | 5 | 0 | 5 | ||
| Delaware | 1 | 0 | 1 | ||
| Florida | 28 | 20 | 8 | ||
| Georgia | 14 | 9 | 5 | ||
| Hawaii | 2 | 0 | 2 | ||
| Idaho | 2 | 2 | 0 | ||
| Illinois | 17 | 3 | 14 | ||
| Indiana | 9 | 7 | 2 | ||
| Iowa | 4 | 4 | 0 | ||
| Kansas | 4 | 3 | 1 | ||
| Kentucky | 6 | 5 | 1 | ||
| Louisiana | 6 | 5 | 1 | ||
| Maine | 2 | 0 | 2 | ||
| Maryland | 8 | 1 | 7 | ||
| Massachusetts | 9 | 0 | 9 | ||
| Michigan | 13 | 6 | 7 | ||
| Minnesota | 8 | 4 | 4 | ||
| Mississippi | 4 | 3 | 1 | ||
| Missouri | 8 | 6 | 2 | ||
| Montana | 2 | 2 | 0 | ||
| Nebraska | 3 | 3 | 0 | ||
| Nevada | 4 | 1 | 3 | ||
| New Hampshire | 2 | 0 | 2 | ||
| New Jersey | 12 | 3 | 9 | ||
| New Mexico | 3 | 0 | 3 | ||
| New York | 26 | 11 | 15 | ||
| North Carolina | 14 | 7 | 7 | ||
| North Dakota | 1 | 1 | 0 | ||
| Ohio | 15 | 10 | 5 | ||
| Oklahoma | 5 | 5 | 0 | ||
| Oregon | 6 | 2 | 4 | ||
| Pennsylvania | 17 | 8 | 9 | ||
| Rhode Island | 2 | 0 | 2 | ||
| South Carolina | 7 | 6 | 1 | ||
| South Dakota | 1 | 1 | 0 | ||
| Tennessee | 9 | 8 | 1 | ||
| Texas | 38 | 25 | 13 | ||
| Utah | 4 | 4 | 0 | ||
| Vermont | 1 | 0 | 1 | ||
| Virginia | 11 | 5 | 6 | ||
| Washington | 10 | 2 | 8 | ||
| West Virginia | 2 | 2 | 0 | ||
| Wisconsin | 8 | 6 | 2 | ||
| Wyoming | 1 | 1 | 0 | ||
| Total | 435 | 222 | 213 | ||
Maps
-
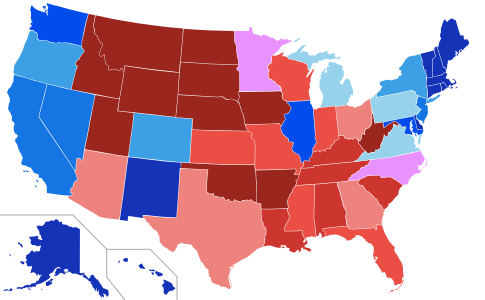
House seats by party holding majority in state
-
Popular vote by states
-
Net changes to U.S. House seats after the 2022 elections
+1 Dem House seat +2 Dem House seats
+1 Rep House seat +2 Rep House seats
+3–4 Rep House seats
Republicans lost 1 seat due to reapportionment -
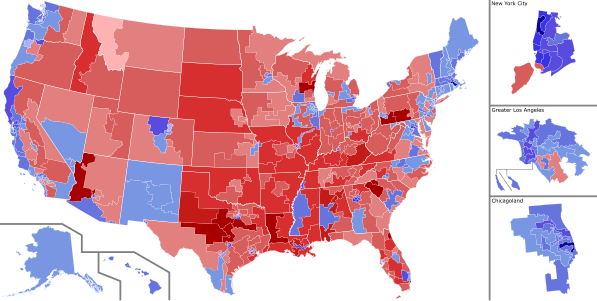
District results by vote share
Notes
- ↑ Also included are five non-voting delegates.


