Probability distribution
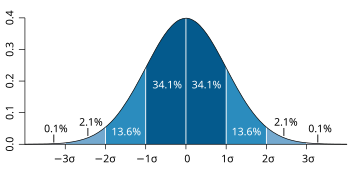
The normal distribution , often called the "bell curve" Probability distribution is a term from mathematics . Suppose there are many events with random outcomes. A probability distribution is the theoretical counterpart to the frequency distribution . A frequency distribution simply shows how many times a certain event occurred. A probability distribution says how many times it should have occurred in the long run (that is, its probability ). The probability distribution of a random variable
X
{\displaystyle X}
f
X
(
x
)
{\displaystyle f_{X}(x)}
f
(
x
)
{\displaystyle f(x)}
[ 1] [ 2] countable ) amount of values, or continuous, taking an uncountable amount of values (as from a continuous interval ).[ 3]
As an example, the probability distribution for a single roll of a normal 6-sided dice can be presented by:
Probability distribution for a dice roll event
Result
1
{\displaystyle 1}
2
{\displaystyle 2}
3
{\displaystyle 3}
4
{\displaystyle 4}
5
{\displaystyle 5}
6
{\displaystyle 6}
Probability of result
1
6
{\displaystyle {\frac {1}{6}
1
6
{\displaystyle {\frac {1}{6}
1
6
{\displaystyle {\frac {1}{6}
1
6
{\displaystyle {\frac {1}{6}
1
6
{\displaystyle {\frac {1}{6}
1
6
{\displaystyle {\frac {1}{6}
where result is the outcome of the dice roll, and the probability shows the chances of that result occurring. If we roll a dice 60 times, then in the long run, we should expect to have each side appear 10 times on average.
There are different probability distributions.[ 4]
Related pages
References
↑ "List of Probability and Statistics Symbols" . Math Vault . 2020-04-26. Retrieved 2020-09-11 .↑ Bourne, Murray. "11. Probability Distributions - Concepts" . www.intmath.com . Retrieved 2020-09-11 . ↑ "1.3.6.1. What is a Probability Distribution" . www.itl.nist.gov . Retrieved 2020-09-11 .↑ "Normal Distribution - easily explained! | Data Basecamp" . 2021-11-26. Retrieved 2023-05-29 .
Continuous data
Count data Summary tables Dependence Graphics
Bar chart Biplot
Box plot
Control chart
Correlogram
Fan chart
Forest plot
Histogram Pie chart Q–Q plot
Run chart
Scatter plot
Stem-and-leaf display
Radar chart
Violin plot
Study design
Population Statistic Effect size
Statistical power
Optimal design
Sample size determination
Replication
Missing data Survey methodology Controlled experiments Adaptive Designs
Adaptive clinical trial
Up-and-Down Designs
Stochastic approximation Observational Studies
Cross-sectional study
Cohort study
Natural experiment
Quasi-experiment
Statistical theory Frequentist inference
Point estimation
Estimating equations
Unbiased estimators
Mean-unbiased minimum-variance
Rao–Blackwellization
Lehmann–Scheffé theorem
Median unbiased
Plug-in Interval estimation Testing hypotheses
1- & 2-tails
Power
Uniformly most powerful test
Permutation test
Multiple comparisons Parametric tests
Likelihood-ratio
Score/Lagrange multiplier
Wald
Specific tests
Goodness of fit Rank statistics
Sign
Signed rank (Wilcoxon)
Rank sum (Mann–Whitney)
Nonparametric anova
1-way (Kruskal–Wallis)
2-way (Friedman)
Ordered alternative (Jonckheere–Terpstra)
Bayesian inference
Correlation Regression analysis
Errors and residuals Regression validation
Mixed effects models
Simultaneous equations models
Multivariate adaptive regression splines (MARS) Linear regression Non-standard predictors
Nonlinear regression
Nonparametric
Semiparametric
Isotonic
Robust
Heteroscedasticity
Homoscedasticity Generalized linear model Partition of variance
Analysis of variance (ANOVA, anova)
Analysis of covariance
Multivariate ANOVA
Degrees of freedom
Categorical / Multivariate / Time-series / Survival analysis
Categorical
Cohen's kappa
Contingency table
Graphical model
Log-linear model
McNemar's test
Cochran-Mantel-Haenszel statistics Multivariate
Regression
Manova
Principal components
Canonical correlation
Discriminant analysis
Cluster analysis Classification
Structural equation model
Multivariate distributions
Time-series
General
Decomposition
Trend
Stationarity
Seasonal adjustment
Exponential smoothing
Cointegration
Structural break
Granger causality Specific tests
Dickey–Fuller
Johansen
Q-statistic (Ljung–Box)
Durbin–Watson
Breusch–Godfrey Time domain
Autocorrelation (ACF)
Cross-correlation (XCF)
ARMA model
ARIMA model (Box–Jenkins)
Autoregressive conditional heteroskedasticity (ARCH)
Vector autoregression (VAR) Frequency domain
Survival
Survival function
Kaplan–Meier estimator (product limit)
Proportional hazards models
Accelerated failure time (AFT) model
First hitting time Hazard function Test
Applications
Biostatistics Engineering statistics
Chemometrics
Methods engineering
Probabilistic design
Process / quality controlReliability
System identification Social statistics Spatial statistics
Cartography Environmental statistics
Geographic information system
Geostatistics
Kriging
The article is a derivative under the Creative Commons Attribution-ShareAlike License .
A link to the original article can be found here and attribution parties here
By using this site, you agree to the Terms of Use . Gpedia ® is a registered trademark of the Cyberajah Pty Ltd