Demographics of Latvia
| Demographics of Latvia | |
|---|---|
 Latvia population pyramid in 2020 | |
| Population | |
| Growth rate | |
| Birth rate | 9.8 births/1,000 population (2019)[3] |
| Death rate | 14.5 deaths/1,000 population (2019)[4] |
| Life expectancy | 73.1 years (2021)[5] |
| • male | 68.2 years |
| • female | 77.9 years |
| Fertility rate | 1.61 children born/woman (2019)[6][7] |
| Infant mortality rate | 3.4 deaths/1,000 live births (2019)[8] |
| Net migration rate | −0.2 migrant(s)/1,000 population (2021)[9] |
| Sex ratio | |
| Total | 0.85 male(s)/female (2020)[10] |
| At birth | 1.05 male(s)/female (2020)[11] |
| Under 15 | 1.06 male(s)/female (2020)[10] |
| 15–64 years | 0.96 male(s)/female[10] |
| 65 and over | 0.49 male(s)/female[10] |
| Nationality | |
| Nationality | noun: Latvian(s) adjective: Latvian |
| Major ethnic | Latvians |
| Minor ethnic | Russians, Belarusians, Ukrainians |
| Language | |
| Official | Latvian |
| Spoken | Latvian, Russian |

This article is about the demographic features of the population of the historical territory of Latvia, including population density, ethnic background, education level, health of the populace, economic status, religious affiliations and other aspects of the population.
History
Latvia was settled by Baltic tribes some three millennia ago. The territories along the eastern Baltic first came under foreign domination at the beginning of the 13th century, with the formal establishment of Riga in 1201 under the German Teutonic Knights.
Latvia, in whole or in parts, remained under foreign rule for the next eight centuries, finding itself at the cross-roads of all the regional superpowers of their day, including Denmark (the Danes held on lands around the Gulf of Riga), Sweden, and Russia, with southern (Courland) Latvia being at one time a vassal to Poland-Lithuania as well as Latgale falling directly under Poland-Lithuania rule. Through all this time, Latvia remained largely under Baltic German hegemony, with Baltic Germans comprising the largest land-owners, a situation which did not change until Latvia's independence.
Historically, Latvia has had significant German, Russian, Jewish, Polish, Belarusian and Lithuanian minorities. The majority (roughly two thirds) of Latvians, under Swedish influences, adopted Lutheranism, while the minority (the remaining third) of Latvians under Poland-Lithuania, Latgale in particular, retained their Catholicism. Aglona, in Latgale, has been the site of annual Catholic pilgrimage for centuries, even through to today.
Recently[when?] introduced immigration law in Latvia provides framework for immigration through investment in various financial areas or real estate. In 2012, solely 2,435[12] applications for residence permit by investment in real estate were received by Office of Citizenship and Migration Affairs. Main immigrant countries are Russia, Belarus, Ukraine and Lithuania (Lithuania is in the European Union, thus no investment is needed). Moreover, Latvia receives residence permit applications from people of nationalities such as Afghans, Chinese, Libyans and people from various other distant countries.
| Year | Pop. | ±% |
|---|---|---|
| 1863 | 1,240,988 | — |
| 1897 | 1,929,387 | +55.5% |
| 1914 | 2,552,000 | +32.3% |
| 1920 | 1,596,131 | −37.5% |
| 1925 | 1,844,805 | +15.6% |
| 1930 | 1,900,045 | +3.0% |
| 1935 | 1,950,936 | +2.7% |
| 1943 | 1,760,162 | −9.8% |
| 1950 | 1,943,146 | +10.4% |
| 1959 | 2,079,948 | +7.0% |
| 1970 | 2,351,903 | +13.1% |
| 1979 | 2,502,816 | +6.4% |
| 1989 | 2,666,567 | +6.5% |
| 2000 | 2,377,383 | −10.8% |
| 2011 | 2,070,371 | −12.9% |
| 2021 | 1,893,223 | −8.6% |
| 2023 | 1,891,000 | −0.1% |
| Source:[13][14][15] | ||
Over 130,000 persons have been naturalized as Latvian citizens since 1995, but 182,375 persons, as of 2022, live in Latvia with non-citizen's passports. Large numbers of Russians, as well as some Ukrainians and Belarusians remained in Latvia after the fall of the Soviet Union.
According to the provisional results of the Population and Housing Census 2011, the total population of Latvia on 1 March 2011 was 2,067,887. Since the previous census in 2000 the country's population decreased by 309,000 or 13%.[16] Based on the Population and Housing Census 2021, the total population of Latvia on 1 January 2021 was 1,893,223. Since the previous census in 2011 the country's population decreased by 174,664 or 8,5%. The proportion of ethnic Latvians increased to 62.7% of the population.[17] Livonians are the other indigenous ethnic group, with about 250 of them remaining.[18] Latgalians are a distinctive subgroup of Latvians inhabiting or coming from Eastern Latvia.
According to rankings provided by the United States Census Bureau—International Data Base (IDB)—Country Rankings, Latvia is estimated to have a population of 1,249,812 in the year 2050.[19]
Population
Age structure
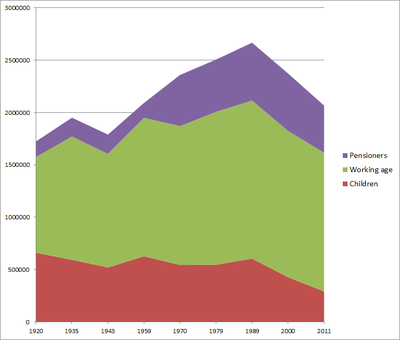
| Census year | Children | Working age | Pensioners |
|---|---|---|---|
| 1897 | 41.0 | 52.8 | 6.2 |
| 1920 | 38.3 | 52.9 | 8.6 |
| 1935 | 30.4 | 60.3 | 9.2 |
| 1943 | 29.1 | 60.6 | 10.3 |
| 1959 | 30.0 | 63.2 | 6.8 |
| 1970 | 23.1 | 56.2 | 20.7 |
| 1979 | 21.8 | 58.3 | 19.9 |
| 1989 | 22.7 | 56.6 | 20.7 |
| 2000 | 18.0 | 58.9 | 23.1 |
| 2011 | 14.1 | 64.1 | 21.8 |
| 2021 | 16.1 | 61.9 | 22.1 |
Vital statistics
Source: Central Statistical Bureau of Latvia[22]
| Average population | Live births | Deaths | Natural change | Crude birth rate (per 1000) | Crude death rate (per 1000) | Natural change (per 1000) | Total fertility rate | Infant mortality rate (per 1000 births) | Life expectancy at birth (males) | Life expectancy at birth (females) | |
|---|---|---|---|---|---|---|---|---|---|---|---|
| 1920 | 1,727,000 | 29,434 | 33,891 | −4,457 | 17.0 | 19.6 | −2.5 | 128.4 | |||
| 1921 | 1,850,000 | 36,420 | 25,331 | 11,089 | 19.7 | 13.7 | 5.9 | 93.2 | |||
| 1922 | 1,883,000 | 41,146 | 27,553 | 13,593 | 21.9 | 14.6 | 7.2 | 90.8 | |||
| 1923 | 1,909,000 | 41,796 | 26,080 | 15,716 | 21.9 | 13.7 | 8.2 | 88.4 | |||
| 1924 | 1,845,000 | 41,172 | 28,399 | 12,773 | 22.3 | 15.4 | 6.9 | 100.8 | 50.7 | 56.9 | |
| 1925 | 1,857,000 | 41,314 | 27,683 | 13,631 | 22.3 | 14.9 | 7.3 | 107.2 | |||
| 1926 | 1,871,000 | 41,073 | 27,557 | 13,516 | 22.0 | 14.7 | 7.2 | 87.9 | |||
| 1927 | 1,883,000 | 41,610 | 28,941 | 12,669 | 22.1 | 15.4 | 6.7 | 95.7 | |||
| 1928 | 1,895,000 | 39,126 | 27,299 | 11,827 | 20.7 | 14.4 | 6.2 | 96.3 | |||
| 1929 | 1,900,000 | 35,673 | 28,512 | 7,161 | 18.8 | 15.0 | 3.7 | 106.7 | |||
| 1930 | 1,910,000 | 37,835 | 27,110 | 10,725 | 19.8 | 14.2 | 5.6 | 90.0 | |||
| 1931 | 1,920,000 | 36,972 | 26,891 | 10,081 | 19.3 | 14.0 | 5.2 | 86.3 | |||
| 1932 | 1,931,000 | 37,366 | 26,342 | 11,024 | 19.4 | 13.6 | 5.7 | 89.3 | |||
| 1933 | 1,939,000 | 34,576 | 26,319 | 8,257 | 17.8 | 13.6 | 4.2 | 76.4 | |||
| 1934 | 1,947,000 | 33,383 | 27,065 | 6,318 | 17.2 | 13.9 | 3.2 | 95.1 | 55.1 | 60.6 | |
| 1935 | 1,953,000 | 34,419 | 27,660 | 6,759 | 17.6 | 14.2 | 3.4 | 78.9 | 55.0 | 61.0 | |
| 1936 | 1,961,000 | 35,468 | 27,646 | 7,822 | 18.1 | 14.1 | 3.9 | 80.1 | |||
| 1937 | 1,968,000 | 34,863 | 28,083 | 6,780 | 17.7 | 14.3 | 3.4 | 85.0 | |||
| 1938 | 1,978,000 | 36,386 | 26,703 | 9,683 | 18.4 | 13.5 | 4.9 | 68.1 | |||
| 1939 | 2,000,000 | 36,932 | 27,827 | 9,105 | 18.5 | 13.9 | 4.6 | 70.2 | |||
| 1940 | 1,940,000 | 37,493 | 30,355 | 7,138 | 19.3 | 15.7 | 3.6 | 73.2 | |||
| 1941 | 1,755,000 | 36,295 | 30,434 | 5,861 | 20.7 | 17.3 | 3.4 | 81.7 | |||
| 1942 | 1,750,000 | 36,370 | 29,940 | 6,430 | 20.7 | 17.1 | 3.6 | 81.1 | |||
| 1943 | 1,760,000 | 35,915 | 29,904 | 6,011 | 20.4 | 16.9 | 3.5 | 93.4 | |||
| 1944 | 2.30 | ||||||||||
| 1945 | 26,217 | 32,230 | −6,013 | 111.1 | |||||||
| 1946 | 1,553,577 | 30,544 | 32,266 | −1,722 | 18.7 | 19.7 | −1.0 | 93.9 | |||
| 1947 | 1,716,773 | 34,832 | 32,435 | 2,397 | 19.5 | 18.2 | 1.3 | 108.7 | |||
| 1948 | 1,856,419 | 35,402 | 26,500 | 8,902 | 18.9 | 14.2 | 4.7 | 79.3 | |||
| 1949 | 1,886,792 | 35,671 | 25,640 | 10,031 | 18.9 | 13.6 | 5.3 | 83.3 | |||
| 1950 | 1,884,077 | 33,137 | 24,250 | 8,887 | 17.6 | 12.9 | 4.7 | 70.0 | |||
| 1951 | 1,889,974 | 32,764 | 23,898 | 8,866 | 17.3 | 12.6 | 4.7 | 69.6 | |||
| 1952 | 1,898,577 | 32,278 | 22,680 | 9,598 | 16.9 | 11.9 | 5.0 | 52.9 | |||
| 1953 | 1,912,837 | 30,986 | 22,761 | 8,225 | 16.1 | 11.8 | 4.3 | 46.8 | |||
| 1954 | 1,939,138 | 33,202 | 22,500 | 10,702 | 17.0 | 11.5 | 5.5 | 45.9 | |||
| 1955 | 1,966,567 | 32,968 | 21,330 | 11,638 | 16.6 | 10.8 | 5.8 | 42.0 | |||
| 1956 | 1,995,354 | 32,590 | 20,339 | 12,251 | 16.1 | 10.1 | 6.0 | 33.9 | |||
| 1957 | 2,040,978 | 33,714 | 21,087 | 12,627 | 16.4 | 10.3 | 6.1 | 32.3 | |||
| 1958 | 2,066,368 | 35,068 | 20,910 | 14,158 | 16.9 | 10.1 | 6.8 | 29.5 | 65.2 | 72.4 | |
| 1959 | 2,079,948 | 35,028 | 22,601 | 12,427 | 16.7 | 10.8 | 5.9 | 30.8 | |||
| 1960 | 2,104,128 | 35,468 | 21,314 | 14,154 | 16.7 | 10.0 | 6.7 | 1.99 | 27.0 | ||
| 1961 | 2,137,830 | 35,993 | 21,759 | 14,234 | 16.7 | 10.1 | 6.6 | 2.01 | 24.1 | 66.1 | 73.5 |
| 1962 | 2,167,531 | 35,061 | 23,592 | 11,469 | 16.1 | 10.8 | 5.3 | 1.91 | 24.2 | ||
| 1963 | 2,195,640 | 33,843 | 22,703 | 11,140 | 15.3 | 10.3 | 5.0 | 1.85 | 25.9 | 67.0 | 74.0 |
| 1964 | 2,226,198 | 33,053 | 21,165 | 11,888 | 14.8 | 9.4 | 5.4 | 1.79 | 22.0 | ||
| 1965 | 2,255,048 | 31,212 | 22,780 | 8,432 | 13.8 | 10.1 | 3.7 | 1.74 | 18.9 | 66.6 | 74.4 |
| 1966 | 2,276,789 | 31,974 | 23,350 | 8,624 | 14.0 | 10.2 | 3.8 | 1.76 | 17.0 | ||
| 1967 | 2,289,645 | 32,232 | 24,362 | 7,870 | 14.0 | 10.6 | 3.4 | 1.80 | 17.3 | ||
| 1968 | 2,312,795 | 32,693 | 25,104 | 7,589 | 14.1 | 10.8 | 3.3 | 1.83 | 18.9 | ||
| 1969 | 2,334,443 | 32,915 | 26,229 | 6,686 | 14.0 | 11.2 | 2.8 | 1.88 | 17.7 | 65.5 | 74.2 |
| 1970 | 2,351,903 | 34,333 | 26,546 | 7,787 | 14.6 | 11.3 | 3.3 | 2.01 | 17.7 | 66.0 | 74.4 |
| 1971 | 2,366,424 | 35,239 | 26,275 | 8,964 | 14.8 | 11.1 | 3.7 | 2.05 | 15.9 | 65.4 | 74.6 |
| 1972 | 2,386,353 | 35,007 | 27,296 | 7,711 | 14.6 | 11.4 | 3.2 | 2.03 | 16.0 | 65.0 | 75.0 |
| 1973 | 2,404,995 | 34,008 | 28,139 | 5,869 | 14.1 | 11.6 | 2.5 | 1.96 | 15.8 | 65.2 | 74.7 |
| 1974 | 2,426,642 | 34,920 | 28,143 | 6,777 | 14.3 | 11.5 | 2.8 | 1.99 | 18.4 | ||
| 1975 | 2,447,730 | 34,810 | 30,042 | 4,768 | 14.2 | 12.2 | 2.0 | 1.96 | 20.3 | 64.2 | 74.3 |
| 1976 | 2,464,529 | 34,644 | 30,373 | 4,271 | 14.0 | 12.3 | 1.7 | 1.93 | 20.1 | 64.4 | 74.3 |
| 1977 | 2,477,449 | 34,240 | 30,869 | 3,371 | 13.8 | 12.4 | 1.4 | 1.88 | 18.3 | 64.5 | 74.2 |
| 1978 | 2,492,697 | 34,258 | 31,261 | 2,997 | 13.7 | 12.5 | 1.2 | 1.86 | 18.1 | 63.7 | 73.9 |
| 1979 | 2,503,145 | 34,683 | 32,162 | 2,521 | 13.8 | 12.8 | 1.0 | 1.86 | 18.3 | 63.6 | 73.9 |
| 1980 | 2,508,761 | 35,534 | 32,100 | 3,434 | 14.1 | 12.8 | 1.3 | 1.88 | 15.3 | 63.6 | 74.2 |
| 1981 | 2,514,640 | 35,732 | 32,090 | 3,642 | 14.2 | 12.7 | 1.5 | 1.88 | 16.0 | 63.9 | 74.4 |
| 1982 | 2,524,202 | 37,477 | 31,234 | 6,243 | 14.8 | 12.3 | 2.5 | 1.97 | 13.9 | 64.0 | 74.5 |
| 1983 | 2,537,958 | 40,572 | 32,330 | 8,242 | 15.9 | 12.7 | 3.2 | 2.12 | 15.9 | 63.9 | 74.5 |
| 1984 | 2,554,063 | 40,847 | 33,406 | 7,441 | 15.9 | 13.0 | 2.9 | 2.14 | 12.9 | 64.4 | 74.2 |
| 1985 | 2,570,030 | 39,751 | 34,166 | 5,585 | 15.4 | 13.2 | 2.2 | 2.08 | 13.0 | 65.5 | 74.5 |
| 1986 | 2,587,716 | 41,960 | 31,328 | 10,632 | 16.1 | 12.0 | 4.1 | 2.21 | 12.8 | 66.3 | 75.0 |
| 1987 | 2,612,068 | 42,135 | 32,150 | 9,985 | 16.0 | 12.2 | 3.8 | 2.21 | 11.3 | ||
| 1988 | 2,641,097 | 41,275 | 32,421 | 8,854 | 15.6 | 12.2 | 3.4 | 2.16 | 11.0 | 66.3 | 75.1 |
| 1989 | 2,665,770 | 38,922 | 32,584 | 6,338 | 14.6 | 12.2 | 2.4 | 2.04 | 11.3 | 65.3 | 75.2 |
| 1990 | 2,668,140 | 37,918 | 34,812 | 3,106 | 14.2 | 13.1 | 1.1 | 2.00 | 13.7 | 64.2 | 74.6 |
| 1991 | 2,658,161 | 34,633 | 34,749 | −116 | 13.1 | 13.1 | 0.0 | 1.86 | 15.7 | 63.8 | 74.8 |
| 1992 | 2,643,000 | 31,569 | 35,420 | −3,851 | 12.1 | 13.5 | −1.4 | 1.74 | 17.6 | 63.3 | 74.8 |
| 1993 | 2,585,675 | 26,759 | 39,197 | −12,438 | 10.4 | 15.3 | −4.9 | 1.52 | 16.2 | 61.6 | 73.8 |
| 1994 | 2,540,904 | 24,256 | 41,757 | −17,501 | 9.6 | 16.6 | −7.0 | 1.41 | 15.7 | 60.7 | 72.9 |
| 1995 | 2,500,580 | 21,595 | 38,931 | −17,336 | 8.7 | 15.7 | −7.0 | 1.27 | 18.8 | 60.8 | 73.1 |
| 1996 | 2,469,531 | 19,782 | 34,320 | −14,538 | 8.1 | 14.0 | −5.9 | 1.18 | 15.9 | 63.9 | 75.6 |
| 1997 | 2,444,912 | 18,830 | 33,533 | −14,703 | 7.7 | 13.8 | −6.1 | 1.13 | 15.3 | 64.2 | 75.9 |
| 1998 | 2,420,789 | 18,410 | 34,200 | −15,790 | 7.6 | 14.2 | −6.6 | 1.12 | 15.0 | 64.1 | 75.5 |
| 1999 | 2,399,248 | 19,396 | 32,844 | −13,448 | 8.1 | 13.7 | −5.6 | 1.18 | 11.3 | 64.9 | 76.2 |
| 2000 | 2,381,715 | 20,302 | 32,205 | −11,903 | 8.6 | 13.6 | −5.0 | 1.25 | 10.3 | 64.6 | 75.8 |
| 2001 | 2,353,384 | 19,726 | 32,991 | −13,265 | 8.4 | 14.1 | −5.7 | 1.22 | 11.0 | 64.2 | 75.5 |
| 2002 | 2,320,956 | 20,127 | 32,498 | −12,371 | 8.7 | 14.1 | −5.4 | 1.25 | 9.8 | 64.4 | 75.9 |
| 2003 | 2,299,390 | 21,151 | 32,437 | −11,286 | 9.2 | 14.2 | −5.0 | 1.32 | 9.4 | 65.4 | 75.7 |
| 2004 | 2,276,520 | 20,551 | 32,024 | −11,473 | 9.1 | 14.2 | −5.1 | 1.29 | 9.3 | 65.5 | 76.1 |
| 2005 | 2,249,724 | 21,879 | 32,777 | −10,898 | 9.8 | 14.6 | −4.8 | 1.39 | 7.7 | 64.9 | 76.3 |
| 2006 | 2,227,874 | 22,871 | 33,098 | −10,227 | 10.3 | 14.9 | −4.6 | 1.46 | 7.4 | 65.0 | 76.1 |
| 2007 | 2,208,840 | 23,958 | 33,042 | −9,084 | 10.9 | 15.0 | −4.1 | 1.54 | 8.5 | 65.3 | 76.2 |
| 2008 | 2,191,810 | 24,397 | 31,006 | −6,609 | 11.2 | 14.2 | −3.0 | 1.58 | 6.6 | 66.5 | 77.4 |
| 2009 | 2,162,834 | 22,044 | 29,897 | −7,853 | 10.3 | 14.0 | −3.7 | 1.46 | 7.6 | 67.5 | 77.6 |
| 2010 | 2,120,504 | 19,781 | 30,040 | −10,259 | 9.4 | 14.3 | −4.9 | 1.36 | 5.6 | 67.9 | 77.9 |
| 2011 | 2,074,605 | 18,825 | 28,540 | −9,715 | 9.1 | 13.9 | −4.8 | 1.33 | 6.6 | 68.6 | 78.5 |
| 2012 | 2,044,813 | 19,897 | 29,025 | −9,128 | 9.8 | 14.3 | −4.5 | 1.44 | 6.3 | 65.9 | 78.7 |
| 2013 | 2,023,825 | 20,596 | 28,691 | −8,095 | 10.2 | 14.3 | −4.1 | 1.52 | 4.4 | 69.3 | 78.8 |
| 2014 | 2,001,468 | 21,746 | 28,466 | −6,720 | 10.9 | 14.3 | −3.4 | 1.65 | 3.8 | 69.1 | 79.3 |
| 2015 | 1,986,096 | 21,979 | 28,478 | −6,499 | 11.1 | 14.4 | −3.3 | 1.70 | 4.1 | 69.7 | 79.3 |
| 2016 | 1,968,957 | 21,968 | 28,580 | −6,612 | 11.2 | 14.6 | −3.4 | 1.74 | 3.7 | 69.8 | 79.4 |
| 2017 | 1,950,116 | 20,828 | 28,757 | −7,929 | 10.7 | 14.8 | −4.1 | 1.69 | 4.1 | 69.8 | 79.6 |
| 2018 | 1,934,379 | 19,314 | 28,820 | −9,506 | 10.0 | 15.0 | −5.0 | 1.60 | 3.2 | 70.0 | 79.6 |
| 2019 | 1,919,968 | 18,786 | 27,719 | −8,933 | 9.8 | 14.5 | −4.7 | 1.61 | 3.4 | 70.8 | 79.9 |
| 2020 | 1,907,675 | 17,552 | 28,854 | −11,302 | 9.2 | 15.2 | −5.9 | 1.55 | 3.5 | 70.4 | 79.5 |
| 2021 | 1,893,223 | 17,420 | 34,600 | −17,180 | 9.0 | 18.0 | −9.1 | 1.57 | 2.7 | 68.2 | 77.9 |
| 2022 | 1,875,757 | 15,535 | 30,346 | –14,811 | 8.3 | 16.2 | -7.8 |
Current vital statistics
| Period | Live births | Deaths | Natural increase |
|---|---|---|---|
| January – February 2022 | 2,540 | 5,635 | −3,095 |
| January – February 2023 | 2,161 | 5,319 | −3,158 |
| Difference |
Immigration
Illegal immigration in Latvia has traditionally been from neighboring countries but now migrants also come from other areas such as Latin America, Southeast Asia and Africa.[24] The Latvian government have sought to work with Russia to stem the problem.[25] In 2009 the US State Department criticized Latvia for its treatment of illegal immigrants.[26]
For an immigrant not to become an illegal resident, a permit is required for a foreign national or a stateless person wishing to reside in the Republic of Latvia for more than 90 days within a 6-month period,[27] thus if the person does not acquire himself a residence permit, he will be considered an illegal immigrant.
| Rank | Nationality | Population (2019)[28] |
|---|---|---|
| 1 | 42,243 | |
| 2 | 2,790 | |
| 3 | 2,413 | |
| 4 | 1,630 | |
| 5 | 611 | |
| 6 | 304 | |
| 7 | 201 | |
| 8 | 188 | |
| 9 | 176 | |
| 10 | 171 | |
| 11 | 169 | |
| 12 | 151 | |
| 13 | 134 | |
| 14 | 128 | |
| 15 | 118 | |
| 16 | 115 | |
| 17 | 96 | |
| 18 | 88 | |
| 19 | 86 | |
| 20 | 82 |
Ethnic groups
Latvia's indigenous population has been ravaged numerous times throughout history. The earliest such event occurred during the conquest of Latvia by Peter the Great in the Great Northern War with Sweden.
In 1897, the first official census in this area indicated that Latvians formed 68.3% of the total population of 1.93 million; Russians accounted for 12%, Jews for 7.4%, Germans for 6.2%, and Poles for 3.4%. The remainder were Lithuanians, Estonians, Romani, and various other nationalities.
The demographics shifted greatly in the 20th century due to the world wars, the expulsion of the Baltic Germans, the Holocaust, and occupation by the Soviet Union. Today, only the Russian minority, which has tripled in numbers since 1935, remains important. The share of ethnic Latvians fell from 75% (1,472,612) in 1935 to 52% (1,387,757) in 1989, after human loss in World War II and human deportation and other repressive measures.
In 2005, there were even fewer Latvians than in 1989, though their share of the population was larger – 1,357,099 (58.8% of the inhabitants). People who arrived in Latvia during the Soviet era, and their descendants born before 21 August 1991, have to pass a naturalization process to receive Latvian citizenship. Their children born after the restoration of independence in 1991 are registered as citizens, if one of the parents requests it.
Ethnic Latvians have been one of the world's slowest-growing ethnic groups for a century.[citation needed] The number of Latvians today is actually less than it was in the 1920s.
Latvians have always been the largest ethnic group in Latvia during the past century, but minority peoples have always been numerous. Never in late modern history have they accounted for more than 80% of the population in Latvia. Before World War 2, the proportion of non-Latvians was approximately 25%, the Russians being the largest minority (approx. 10%), followed by Jews (approx. 5%), Germans and Poles (2–3%). After World War 2 only small numbers of Jews and Germans remained and following mass colonization of Russians, Latvians almost became a minority. There were also settlers from Belarus and Ukraine. In 1989, the proportion of Latvians had decreased to only 52% (from 75.5% in 1935). Despite the decreasing number of Latvians due to low fertility rates, the proportion of Latvians has considerably increased during the past two decades and reached 62.1% in 2011 (slightly higher than the 62.0% in 1959). This is due to large scale emigration of Russians, Ukrainians and Belarusians. The number of these peoples almost halved between 1989 and 2011.[citation needed]
| Ethnic group |
census 1897[29] | census 1925[29] | census 1935[29] | census 1959[30] | census 1970[31] | census 1979[32] | census 1989[33] | census 2000[34] | census 2011[16] | statistics 2018[35] | census 2021[17] | |||||||||||
|---|---|---|---|---|---|---|---|---|---|---|---|---|---|---|---|---|---|---|---|---|---|---|
| Number | % | Number | % | Number | % | Number | % | Number | % | Number | % | Number | % | Number | % | Number | % | Number | % | Number | % | |
| Latvians | 1,318,112 | 68.3 | 1,354,126 | 73.4 | 1,472,612 | 75.5 | 1,297,881 | 62.0 | 1,341,805 | 56.8 | 1,344,105 | 53.7 | 1,387,757 | 52.0 | 1,370,703 | 57.7 | 1,285,136 | 62.1 | 1,202,781 | 62.2 | 1,187,891 | 62.7 |
| Russians | 152,681 | 7.9 | 193,648 | 10.5 | 206,499 | 10.6 | 556,448 | 26.6 | 704,599 | 29.8 | 821,464 | 32.8 | 905,515 | 34.0 | 703,243 | 29.6 | 557,119 | 26.9 | 487,250 | 25.2 | 463,587 | 24.5 |
| Belarusians | 79,523 | 4.1 | 38,010 | 2.1 | 26,867 | 1.4 | 61,587 | 2.9 | 94,898 | 4.0 | 111,505 | 4.5 | 119,702 | 4.5 | 97,150 | 4.1 | 68,202 | 3.3 | 62,713 | 3.2 | 58,632 | 3.1 |
| Ukrainians[36][37] | — | 512 | 0.03 | 1,844 | 0.09 | 29,440 | 1.4 | 53,461 | 2.3 | 66,703 | 2.7 | 92,101 | 3.5 | 63,644 | 2.7 | 45,798 | 2.2 | 43,128 | 2.2 | 42,282 | 2.2 | |
| Poles | 65,056 | 3.4 | 51,143 | 2.8 | 48,949 | 2.5 | 59,774 | 2.9 | 63,045 | 2.7 | 62,690 | 2.5 | 60,416 | 2.3 | 59,505 | 2.5 | 44,772 | 2.2 | 39,687 | 2.1 | 37,203 | 2.0 |
| Lithuanians | 26,033 | 1.3 | 23,192 | 1.3 | 22,913 | 1.2 | 32,383 | 1.6 | 40,589 | 1.7 | 37,818 | 1.5 | 34,630 | 1.3 | 33,430 | 1.4 | 24,479 | 1.2 | 22,831 | 1.2 | — | |
| Roma | — | 2,870 | 0.2 | 3,839 | 0.2 | 4,301 | 0.2 | 5,427 | 0.2 | 6,134 | 0.3 | 7,044 | 0.3 | 8,205 | 0.3 | 6,489 | 0.3 | 5,082 | 0.3 | — | ||
| Jews | 142,315 | 7.4 | 95,675 | 5.2 | 93,479 | 4.8 | 36,592 | 1.8 | 36,680 | 1.6 | 28,331 | 1.1 | 22,897 | 0.9 | 10,385 | 0.4 | 6,437 | 0.3 | 4,721 | 0.2 | — | |
| Germans | 120,191 | 6.2 | 70,964 | 3.8 | 62,144 | 3.2 | 1,609 | 0.08 | 5,413 | 0.2 | 3,299 | 0.1 | 3,783 | 0.1 | 3,465 | 0.1 | 3,042 | 0.1 | 2,554 | 0.1 | — | |
| Estonians | 17,990 | 0.93 | 7,893 | 0.4 | 7,014 | 0.4 | 4,610 | 0.2 | 4,334 | 0.2 | 3,681 | 0.2 | 3,312 | 0.1 | 2,652 | 0.1 | 2,007 | 0.1 | 1,676 | 0.09 | — | |
| Livonians | — | 1,268 | 0.07 | 944 | 0.05 | 185 | 0.01 | 48 | 0.0 | 107 | 0.0 | 135 | 0.01 | 180 | 0.01 | 250 | 0.01 | 161 | 0.01 | — | ||
| Others | 7,486 | 0.39 | 5,504 | 0.3 | 3,398 | 0.2 | 8,648 | 0.4 | 13,828 | 0.6 | 16,979 | 0.7 | 29,275 | 1.1 | 24,824 | 1.1 | 26,640 | 1.3 | 61,795 | 3.2 | 103,628 | 5.5 |
| Total | 1,929,387 | 1,844,805 | 1,950,502 | 2,093,458 | 2,364,127 | 2,502,816 | 2,666,567 | 2,377,383 | 2,070,371 | 1,934,379 | 1,893,223 | |||||||||||
|

|
|
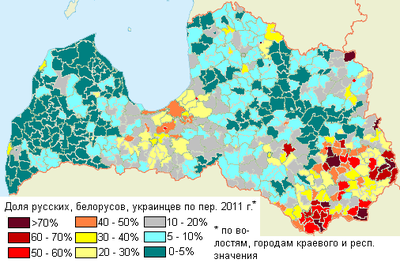
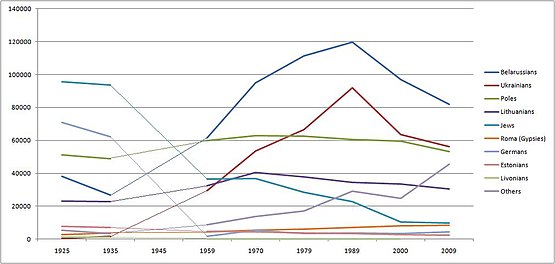
| Distribution of Russians, Belarusians and Ukrainians in 2011 | Number of ethnic Latvians and Russians 1925–2009 | Numbers of smaller ethnic minorities 1925–2009 |
Languages
- official: Latvian[39]
- considered indigenous in some legislation: Livonian, Latgalian[39]
- other languages registered as main language spoken at home by at least 500 speakers in 2011 census (in declining order): Russian, Belarusian, Ukrainian, Lithuanian, Polish, Romani, Tatar, Yiddish and Hebrew, Estonian, German[38]
- other languages widely spoken: English (46%)[40]
- Latvian Sign Language (legally recognised and supported)[39] and Russian Sign Language[41]
In the 2011 census, 1,164,894 persons in Latvia reported Latvian as their main language spoken at home; 698,757 respondents listed Russian as their main language spoken at home,[38] representing 37.2% of the total population, whereas Latvian was recorded as the main language spoken at home for 62.1%.[42] Latvian was spoken as a second language by 20.8% of the population, and 43.7% spoke Russian as a second language.[43] In total, 71% of ethnic Latvians said they could speak Russian, and 52% of Russians could speak Latvian in the 2000 census.[44]
In August 2019, the Central Statistical Bureau published new data indicating that Latvian was the native language of 60.8% of Latvia's population per 1 January 2018, a 2.6% increase compared to the 2000 census. 62.2% of the population was 'ethnically Latvian'. The percentage of native Latvian speakers increased in all statistical regions, especially in the Rīga capital region and Pierīga region around it (4.6%). The number of native Russian speakers dropped in all regions; in Latgale, the number of native Russian speakers also dropped, although their percentage remained the same at 55.5%, the highest of the country. Compared to the 2011 census, the share of people speaking Latvian at home rose by 1.9%, while the number of Russian home speakers dropped by 2.6%. 90.7% of ethnic Russians indicated they spoke Russian at home, while 8.5% of them indicated they spoke Latvian at home. Inter-linguistic marriage was an important factor why, for example, some non-native Latvian speakers who married native Latvian speakers switched to speaking Latvian at home. The percentage of Russian home speakers gradually increased with age from 30.0% amongst 0–4-year-olds to 44.2% amongst 55–64-year-olds, while Latvian home speakers gradually decreased with age from 69.2% amongst 0–4-year-olds to 55.0% amongst 55–64-year-olds, indicating that children in Latvia are increasingly being raised and educated in Latvian.[45]
Religion
The largest religion in Latvia is Christianity (79%),[46] though only about 7% of the population attends religious services regularly.[47] The largest groups as of 2011[update] were:
- Evangelical Lutheran Church of Latvia – 708,773[46]
- Roman Catholic – 500,000[46]
- Russian Orthodox – 370,000[46]
In the Eurobarometer Poll 2010, 38% of Latvian citizens responded that "they believe there is a God", while 48% answered that "they believe there is some sort of spirit or life force" and 11% stated that "they do not believe there is any sort of spirit, God, or life force".
Lutheranism was more prominent before the Soviet occupation, when it was a majority religion of ~60% due to strong historical links with the Nordic countries and influence of the Hansa, and Germany in general. Since then, Lutheranism has declined to a slightly greater extent than Roman Catholicism in all three Baltic states. The Evangelical Lutheran Church, with an estimated 600,000 members in 1956, was affected most adversely. An internal document of 18 March 1987, near the end of communist rule, spoke of an active membership that had shrunk to only 25,000 in Latvia, but the faith has since experienced a revival.[48] Moreover, modern Evangelical Protestant denominations are spreading worldwide, including Latvia. The country's Orthodox Christians belong to the Latvian Orthodox Church, a semi-autonomous body within the Russian Orthodox Church. In 2011, there were 416 Jews and 319 Muslims living in Latvia.[46]
There are more than 600 Latvian neopagans, Dievturi, whose religion is based on Latvian mythology.[49] About 21% of the total population is not affiliated with a specific religion.[46]
See also
References
- ^ "IRS010m. Population and main data of vital statistics 1995M01 – 2021M11". Statistikas datubāzes. Archived from the original on 12 May 2021. Retrieved 8 January 2022.
- ^ "Latvia Population (2021) – Worldometer". www.worldometers.info. Retrieved 31 March 2021.
- ^ "IDG140. Crude births rate in regions, cities under state jurisdiction and counties (per 1000 population)". Statistikas datubāzes. Retrieved 31 March 2021.
- ^ "IMG081. Crude death rate in regions, cities under state jurisdiction and counties (per 1000 population)". Statistikas datubāzes. Retrieved 31 March 2021.
- ^ "Paredzamais mūža ilgums | Central Statistical Bureau of Latvia". stat.gov.lv. Retrieved 23 January 2023.
- ^ "IDG130. Fertility rates (age-specific, total, gross and net reproduction rate, crude birth rate)". Statistikas datubāzes. Retrieved 31 March 2021.
- ^ "Children born per woman". Our World in Data. Retrieved 31 March 2021.
- ^ "Infant mortality rate | Central Statistical Bureau of Latvia". www.csb.gov.lv. Retrieved 31 March 2021.
- ^ "Iedzīvotāju skaits un tā izmaiņas". OPS Latvijas oficiālā statistika. Retrieved 23 January 2023.
- ^ a b c d "IRG120. Population of Latvia by citizenship and sex at the beginning of the year (by 5-years age groups)". Statistikas datubāzes. Retrieved 31 March 2021.
- ^ "IE040m. Live births and deaths by sex and by month". Statistikas datubāzes. Retrieved 31 March 2021.
- ^ "Statistics – residence permit requests". Immigration-residency.eu. 2013. Retrieved 22 June 2015.
- ^ "Number of Resident Population in Latvia". Central Statistics Office of Latvia. Archived from the original on 8 May 2016. Retrieved 14 June 2017.
- ^ "Population Census 2011 – Key Indicators". Central Statistics Office of Latvia. Archived from the original on 29 May 2016. Retrieved 14 June 2017.
- ^ "Latvijas 2021. gada tautas un mājokļu skaitīšanas galvenie rezultāti". Archived from the original on 19 January 2023. Retrieved 19 January 2023.
- ^ a b "Population Census 2011 – Key Indicators – Latvijas statistika". Csb.gov.lv. Retrieved 7 November 2017.
- ^ a b "Latvijas 2021. gada tautas un mājokļu skaitīšanas galvenie rezultāti". stat.gov.lv (in Latvian). Retrieved 19 January 2023.
- ^ "Livonians (Livs) | On Latvia". Retrieved 6 May 2021.
- ^ "International Data Base Country Rankings". Census.gov. Archived from the original on 29 March 2017. Retrieved 25 September 2016.
- ^ "Demographic and Social Statistics". United Nations Statistics Division. Retrieved 7 November 2017.
- ^ "ISG010. Iedzīvotāju skaits, tā izmaiņas un dabiskās kustības galvenie rādītāji".[permanent dead link]
- ^ "Central Statistical Bureau of Latvia".
- ^ "Vital statistics by month".
- ^ "Illegal immigrants from Africa and Latin America increase in Latvia". The Baltic Times. Retrieved 15 April 2012.
- ^ "Estonia urges cooperation with Russia in fighting illegal immigration". Baltic Review. Archived from the original on 14 April 2012. Retrieved 15 April 2012.
- ^ "2009 Human Rights Report: Latvia". US State Department. Retrieved 15 April 2012.
- ^ "Statistics show immigration in Latvia is growing". Baltic Legal. Retrieved 18 August 2012.
- ^ "Archived copy" (PDF). Archived from the original (PDF) on 23 July 2020. Retrieved 23 July 2020.
{cite web}: CS1 maint: archived copy as title (link) - ^ a b c "Ethnicities in region of Latvia. Statistics". roots-saknes.lv. Retrieved 2 January 2010.
- ^ Всесоюзная перепись населения 1959 года. Национальный состав населения по республикам СССР (in Russian). demoscope.ru. Archived from the original on 16 March 2010. Retrieved 2 January 2010.
- ^ Всесоюзная перепись населения 1970 года. Национальный состав населения по республикам СССР (in Russian). demoscope.ru. Archived from the original on 3 December 2009. Retrieved 2 January 2010.
- ^ Всесоюзная перепись населения 1979 года. Национальный состав населения по республикам СССР (in Russian). demoscope.ru. Archived from the original on 24 March 2010. Retrieved 2 January 2010.
- ^ Всесоюзная перепись населения 1989 года. Национальный состав населения по республикам СССР (in Russian). demoscope.ru. Archived from the original on 16 March 2010. Retrieved 2 January 2010.
- ^ "Integrācijas politika Latvijā: daudzpusīga pieeja" (in Latvian). 10 April 2010. Archived from the original on 10 May 2011. Retrieved 26 December 2015.
- ^ "Meklēt | Oficiālās statistikas portāls". Data.csb.gov.lv. Retrieved 20 March 2022.
- ^ "Численность и удельный вес украинцев в Латвии, 1897–2011 гг. / Завьялов А. В. Социальная адаптация украинских иммигрантов : монография / А. В. Завьялов. – Иркутск : Изд-во ИГУ, 2017. – 179 с." (PDF).
- ^ "Численность и удельный вес украинцев в муниципальных образованиях Латвии, 2011 г. / Завьялов А. В. Социальная адаптация украинских иммигрантов : монография / А. В. Завьялов. – Иркутск : Изд-во ИГУ, 2017. – 179 с." (PDF).
- ^ a b c "Archived copy" (PDF). Archived from the original (PDF) on 14 November 2013. Retrieved 23 February 2014.
{cite web}: CS1 maint: archived copy as title (link) - ^ a b c Saeima (21 December 1999). "Official Language Law". Likumi.lv. Latvijas Vēstnesis. Retrieved 26 June 2020.
- ^ "SPECIAL EUROBAROMETER 386 Europeans and their Languages" (PDF). Ec.europa.eu. Retrieved 7 November 2017.
- ^ Meulder, Maartje De (2015). "The Legal Recognition of Sign Languages". Sign Language Studies. 15 (4): 498–506. doi:10.1353/sls.2015.0018. ISSN 1533-6263. S2CID 146701917.
- ^ "Latvijas statistikas datubāzes". Archived from the original on 27 February 2014. Retrieved 23 February 2014.
- ^ LR CSP preses izlaidums: 2000. Gada Tautas Skaitīšana Latvijā; 07.11.2000. Archived 2006-09-11 at the Wayback Machine(in Latvian)
- ^ "Valsts valoda – Statistiska". Vvk.lv. Retrieved 7 November 2017.
- ^ a b "Latvian is the mother tongue of 60.8% of the population of Latvia". lsm.lv. Public Broadcasting of Latvia. 5 August 2019. Retrieved 26 June 2020.
- ^ a b c d e f g "Tieslietu ministrijā iesniegtie reliģisko organizāciju pārskati par darbību 2011. gadā" (in Latvian). Archived from the original on 26 November 2012. Retrieved 25 July 2012.
- ^ Eunice K. Y. Or (23 September 2004). "Trust in Religious Institutions does not convey to Church Attendance". Christian Today. Retrieved 28 July 2007.
- ^ "Latvia – SOCIETY". Mongabay.com. 18 March 1987. Retrieved 12 August 2010.
- ^ "Statistics of approved parishes in Latvia". Reliģiju Enciklopēdija (in Latvian). The Latvian Bible Society. 1 January 2004. Archived from the original on 5 February 2007. Retrieved 7 March 2007.
External links
- Naturalization Board of the Republic of Latvia: Figures and facts
- Office of Citizenship and Migration Affairs: Statistics Archived 17 July 2011 at the Wayback Machine
